Just as the planet swivels on the poles, so too does the fate of its coastlines. The disaster movie effects of climate change—drowning coastlines and raging blizzards, for instance—are tied to thawing ice sheets and glaciers in the Arctic and Antarctica. Research published throughout 2014 made this all the clearer—and scarier.
Just as the planet swivels on the poles, so too does the fate of its coastlines. The disaster movie effects of climate change—drowning coastlines and raging blizzards, for instance—are tied to thawing ice sheets and glaciers in the Arctic and Antarctica. Research published throughout 2014 made this all the clearer—and scarier.
Here’s a roundup of what we learned this year about melting ice sheets:
Join 500,000+ readers who start their day with Quartz.
By subscribing, you agree to our Terms of Service and Privacy Policy.
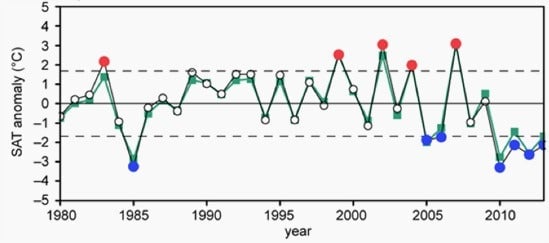
Though scientists have known that the Arctic is warming more than twice as fast as the global average, the south pole is harder to measure.
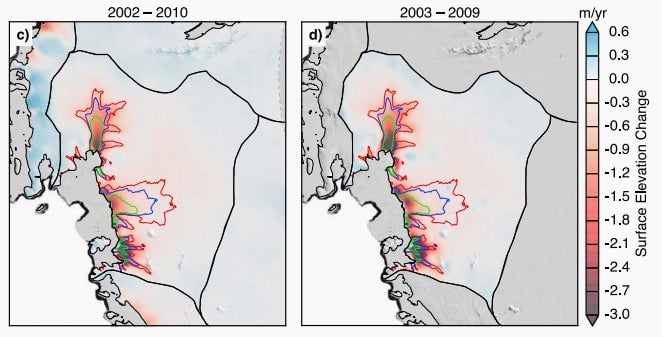
Well, this just in: Since 1992, an annual average of 83 gigatons (91.5 billion tons) of West Antarctic glacier has dripped into the sea. That’s the rough equivalent of losing a Mt. Everest’s worth of ice every two years, according to a new study (pdf) by University of California, Irvine, and NASA’s Jet Propulsion Laboratory. The rate of loss increased an average of 16.3 gigatons a year between 2003 and 2009 (the years during which the four observational techniques used for measurement all overlapped), nearly three times the average rate since 1992.
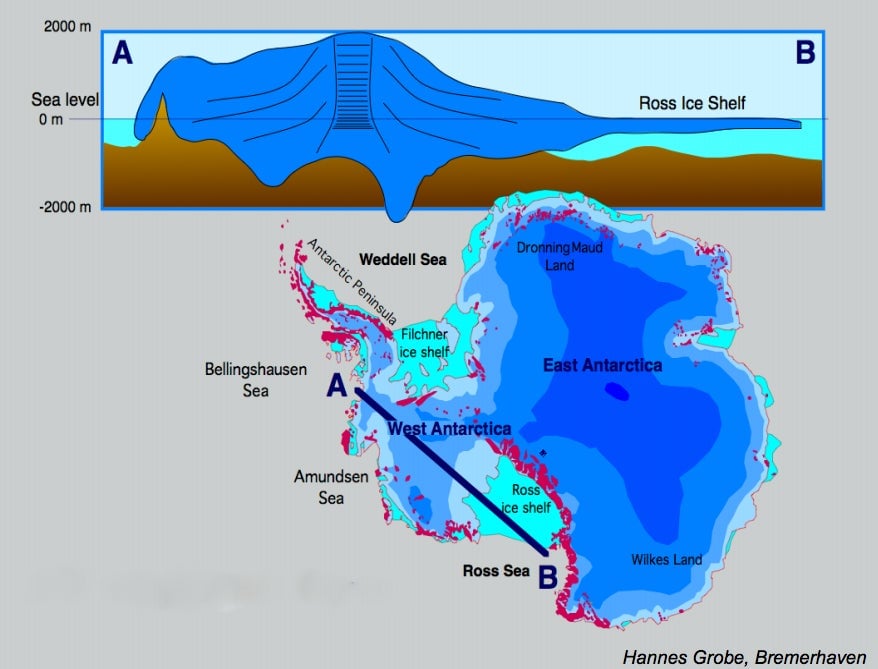
This is especially distressing because, compared to the eastern ice sheet, much more of West Antarctica’s huge glaciers sit below sea level. This makes them more vulnerable to warming sea temperatures, and to changes in wind and air circulation.
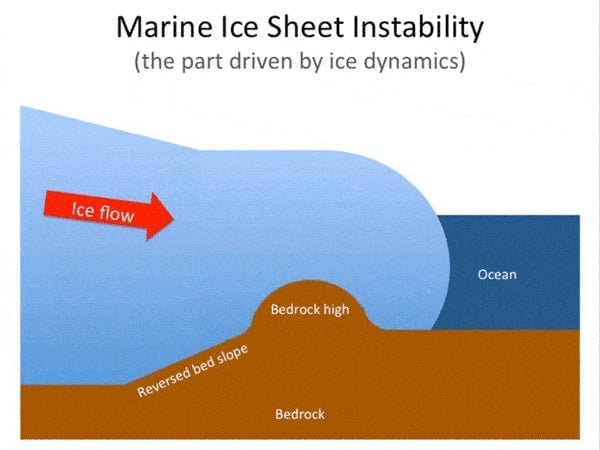
Once the ice mass shrinks beyond a certain point, no ridges or mountains will prevent the ice from eventually imploding into a pile of chunky slush—or ”collapsing,” as it’s called.
This process is likely now inevitable, according to two studies published in May. While scientists have had a hunch that rising temperatures are speeding this collapse, the two papers explain that West Antarctica’s glaciers appear to have retreated beyond the threshold where the collapse can still be prevented, as we explain in detail here.
Mind you, that implosion is still at least two centuries—and possibly as much as a millennium—away. But when it happens, it will send sea levels surging more than three meters (10 feet).
That 3-meter rise, of course, is only what would happen if West Antarctica collapsed. Were Greenland’s ice sheet to melt, it would add another seven meters to sea levels.
While that, too, is likely a long way off, two studies published in December suggest that Greenland’s ice sheet is melting far faster than we realize. Specifically, the Intergovernmental Panel on Climate Change calculates that by 2100, Greenland will contribute 8.7 inches to a global sea-level rise of between 0.4 and 0.75 meters (15 and 30 inches. However, while one study (paywall) found that its models don’t account for melting caused by glacial lakes—which one researcher says could nearly double that contribution—another finds that the simulations fail to account for the rapid thawing of southeast Greenland.
One reason the world grew more aware of the poles in 2014 is that infamous vortex. Add to that icy onslaught Buffalo’s November mega-blizzard and it all seems pretty dissonant with the climate records for the year—for instance, that the northern hemisphere’s 2014 snow cover came in well below average for the 10th year in a row, while hitting its lowest level in Eurasia since 1967.
Here’s what scientists think is happening: As snow cover and sea-ice melts, sunlight that it normally would have reflected is instead absorbed by the land and ocean. For instance, Greenland ice sheet’s albedo—the amount of sunlight it reflects—hit a record monthly low in Aug. 2014.
Warmer seas eat away at ice sheets. And to refreeze come winter, this extra heat must first be released into the air, warming the atmosphere even more—a cycle called “Arctic Amplification.”
Arctic Amplification may be weakening the jet stream—the eastward-blowing air currents that whip around the globe, which is now 14% slower than it was in the 1990s—allowing icy Arctic air to flow further and further south, according to a hypothesis put forth in 2012 (pdf).
This cycle could be the culprit behind the recent spate of cold snaps in Europe, Asia, and the US. The link isn’t conclusive—weather patterns are highly chaotic—and many scientists are still skeptical. However, a paper published in October (paywall) lends still more support to this theory.
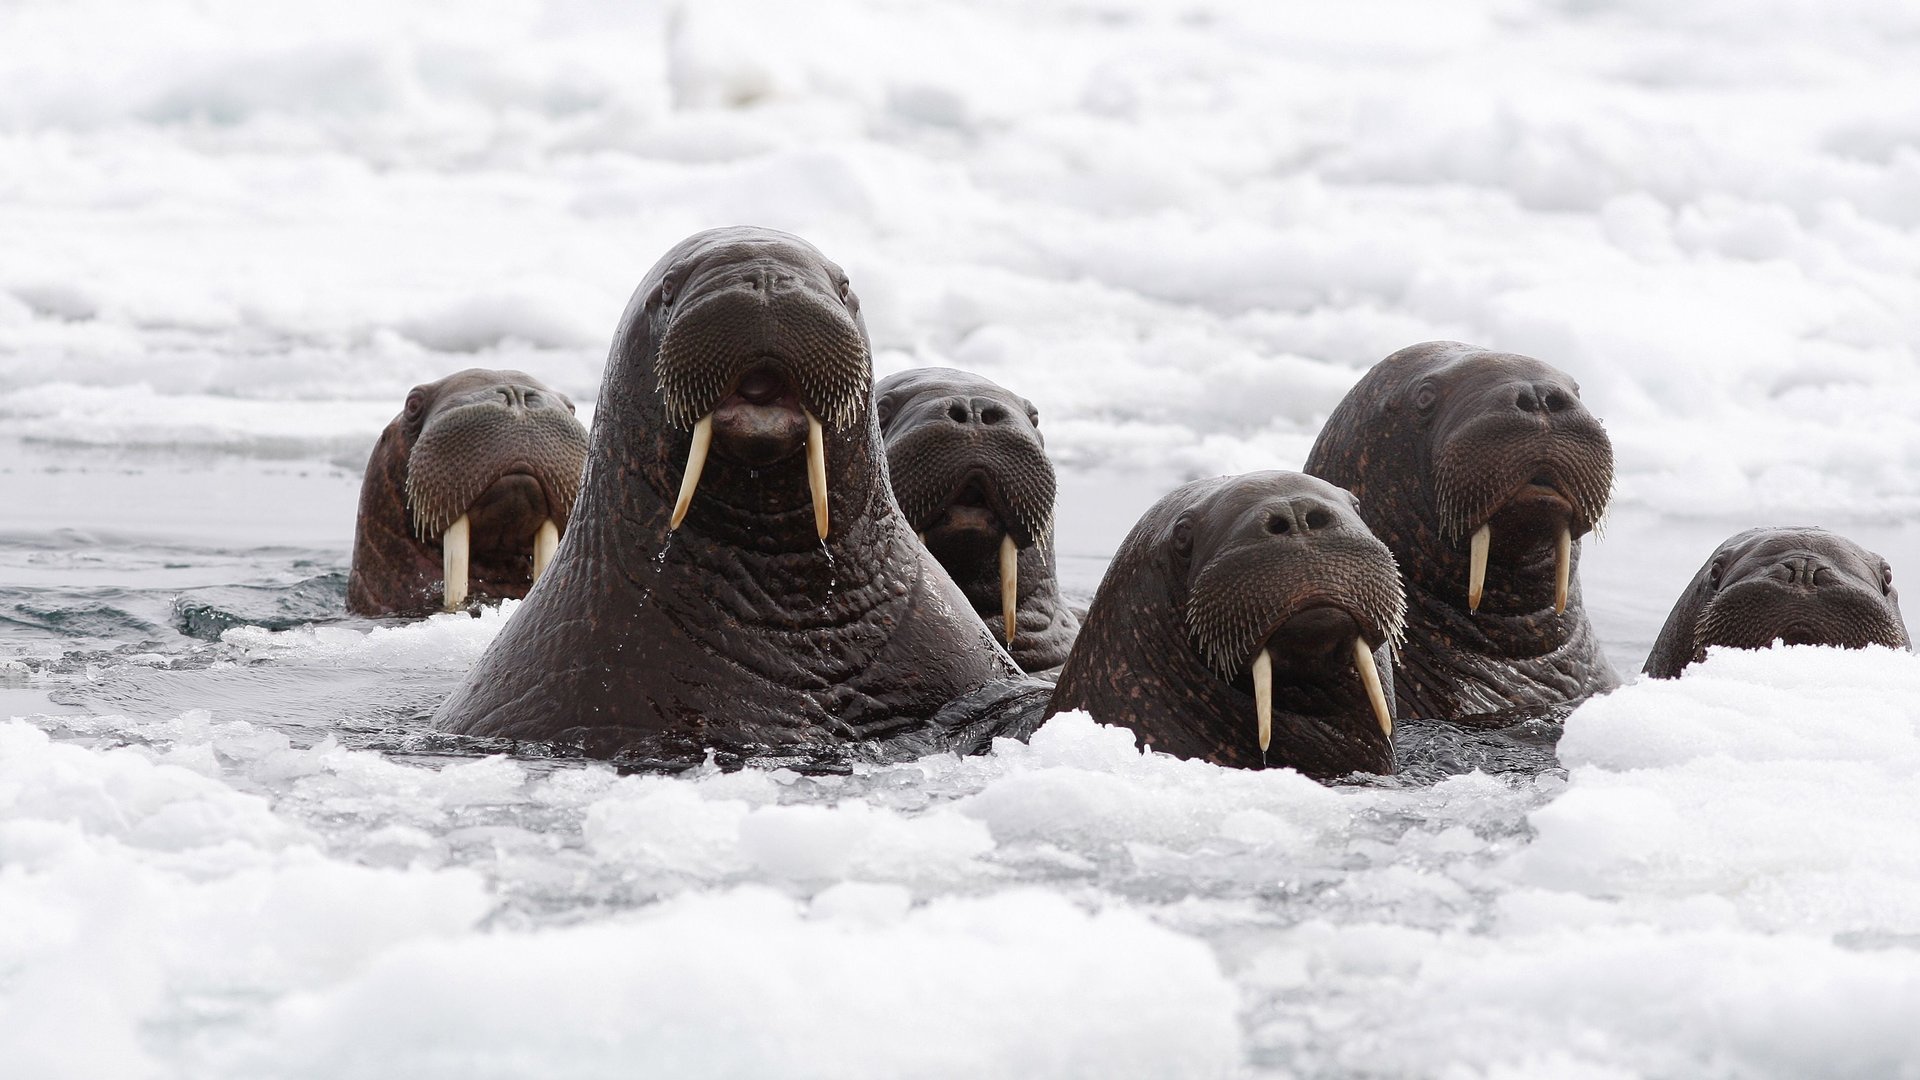
This year, the plight of animals of the polar north and south attracted unusual attention. After snowy owls invaded the northern US, some 35,000 walruses thronged northwest Alaska, as shrinking sea ice drove them further south. That problem is also driving down polar bear numbers in western Hudson Bay—reversing a recent stabilization of their populations—making it more likely that they’ll start interbreeding with brown bears.
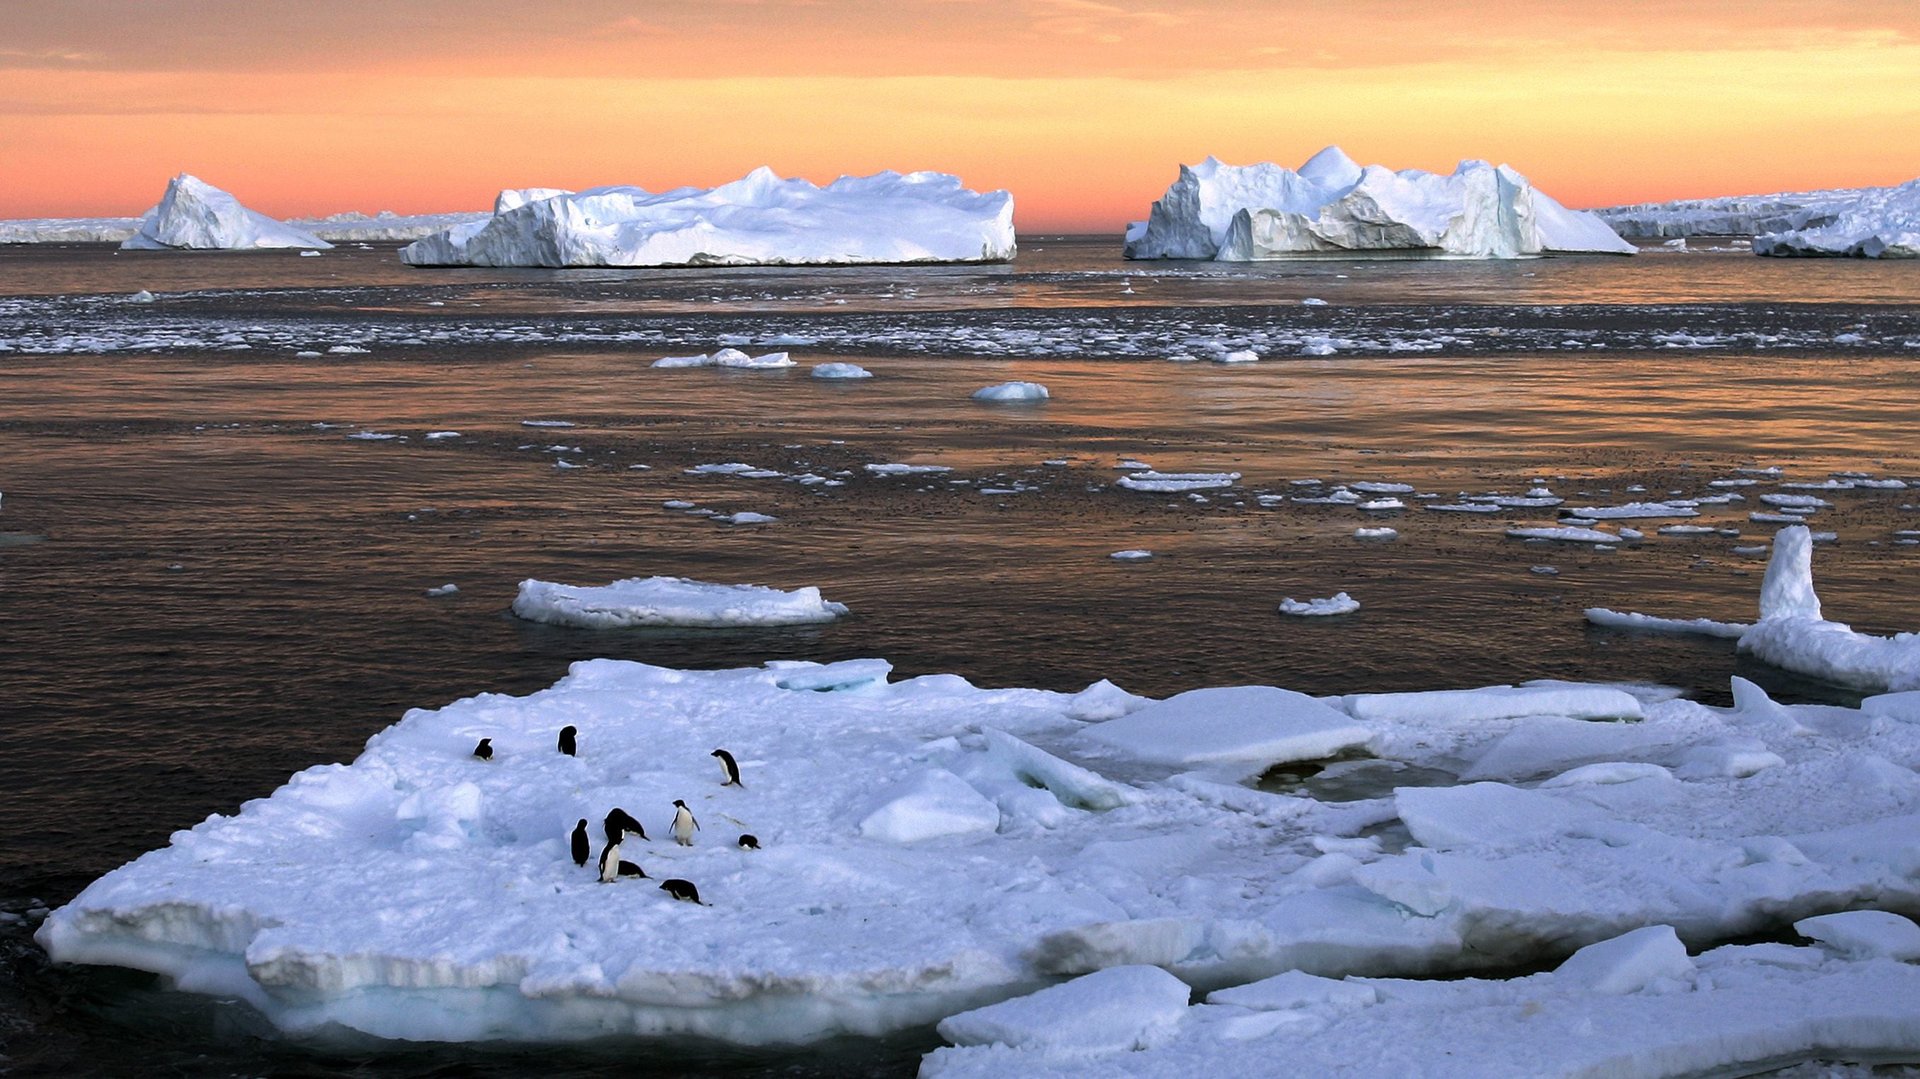
And on the opposite pole, Antarctica’s emperor penguins, which breed on sea ice, face falling populations too.
Those effects are perhaps to be expected. But as 2014 revealed, there are a good many other effects of melting polar ice sheets that few are watching out for.
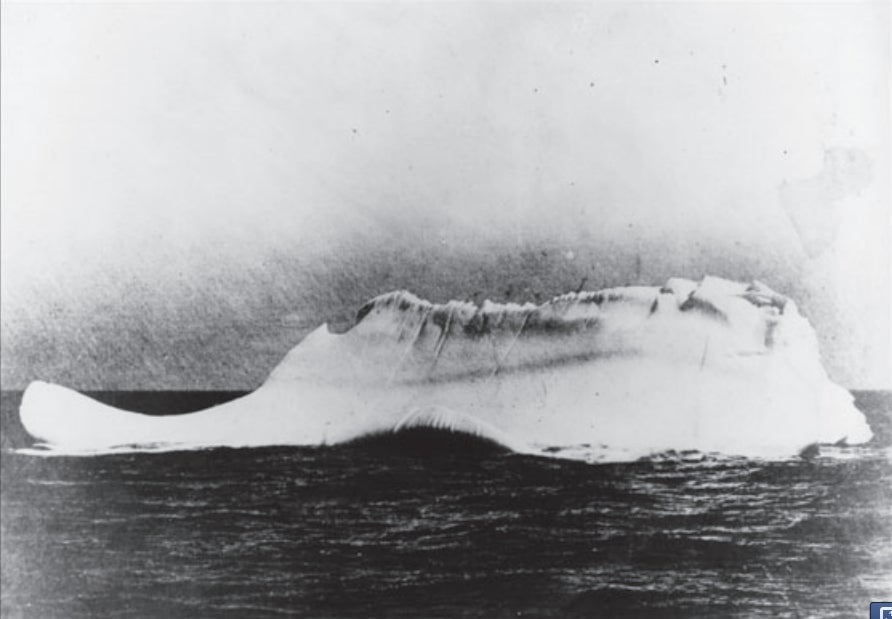
Waves, for one. Usually, the Arctic’s blanket of sea ice prevents the wind from whipping up much chop. However, the peel-back of Arctic ice means the creation of an entirely new swath of ocean—and of “house-sized waves,” according to Jim Thomson, a University of Washington physicist who reported the phenomenon (pdf). In related research, scientists researching historical iceberg data (pdf) found that Titanic-esque iceberg hazards have climbed since 1990, thanks to melting polar ice sheets.
These unexpected changes aren’t isolated to the sea, though. For instance, earlier this year, scientists in Siberia’s Yamal Peninsula found methane in concentration 50,000 times higher than the atmospheric average seeping from a crater that had been covered by a now-collapsed sheet of permafrost, as we recently highlighted.
Of course, this wasn’t the first year that alarming developments at the Earth’s ends seized the world’s attention. But thanks to several big scientific breakthroughs, 2014 will likely go down as the year that melting polar ice caps graduated from being a geographic abstraction to a symbol of the irreversible ways we’ve warped the planet.