The 11 most important economic charts of the week
Yes, it’s Jobs Friday, but lots of other chart-worthy stuff happened in the global economy this week—much of it scary.

Yes, it’s Jobs Friday, but lots of other chart-worthy stuff happened in the global economy this week—much of it scary.
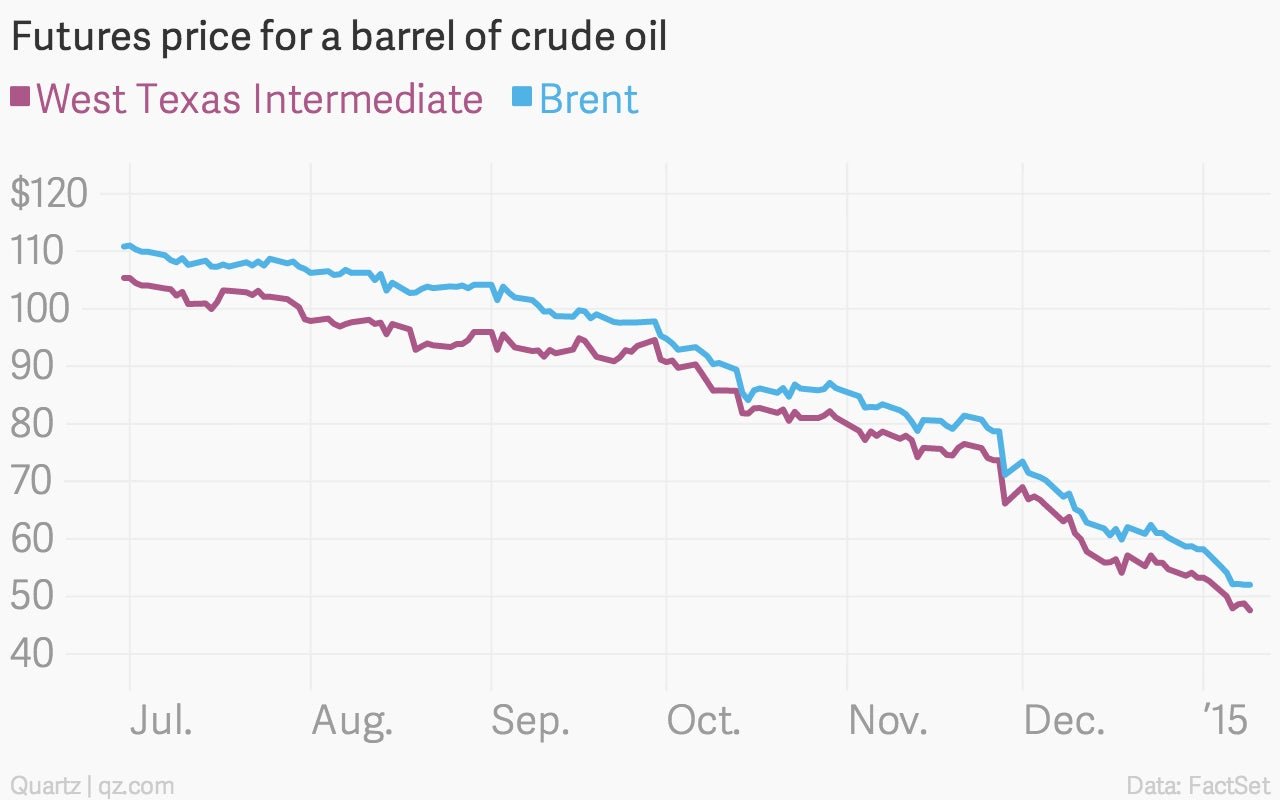
Oil prices are still falling
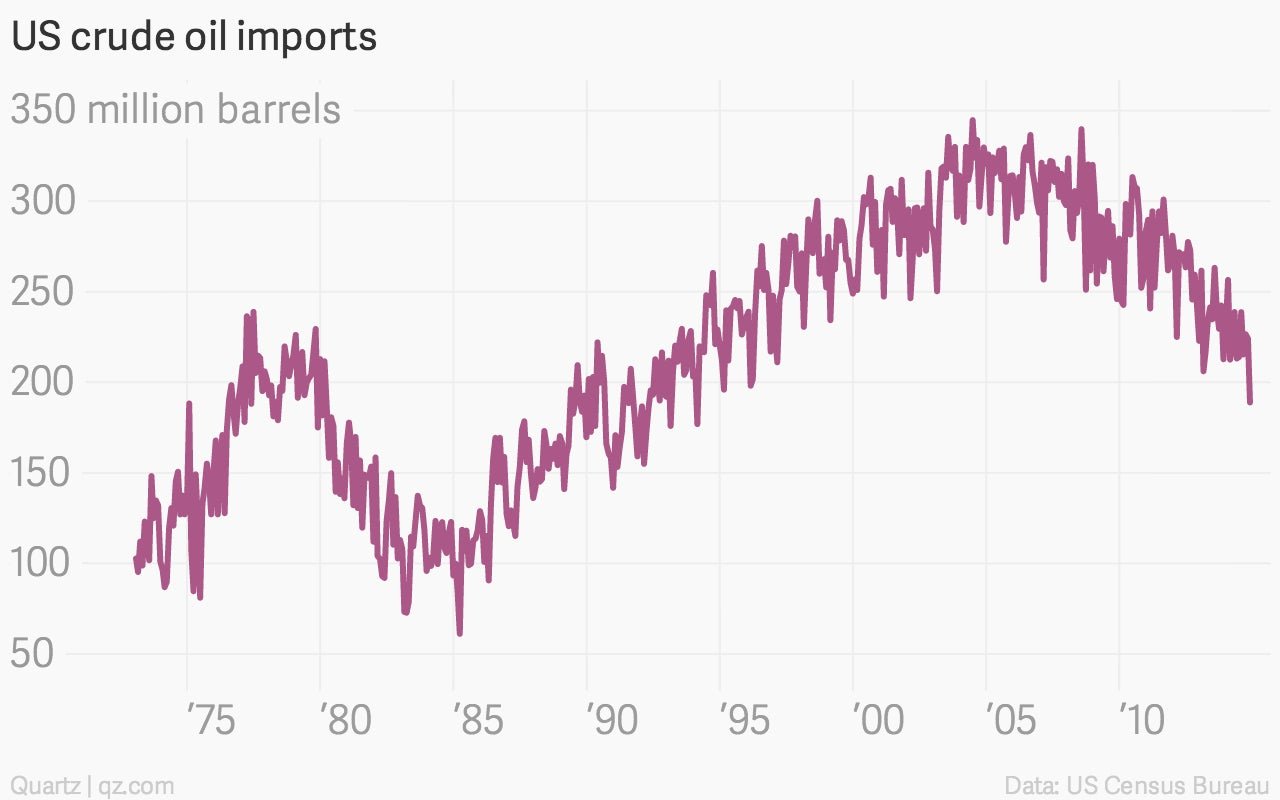
US oil imports are the lowest they’ve been in a decade
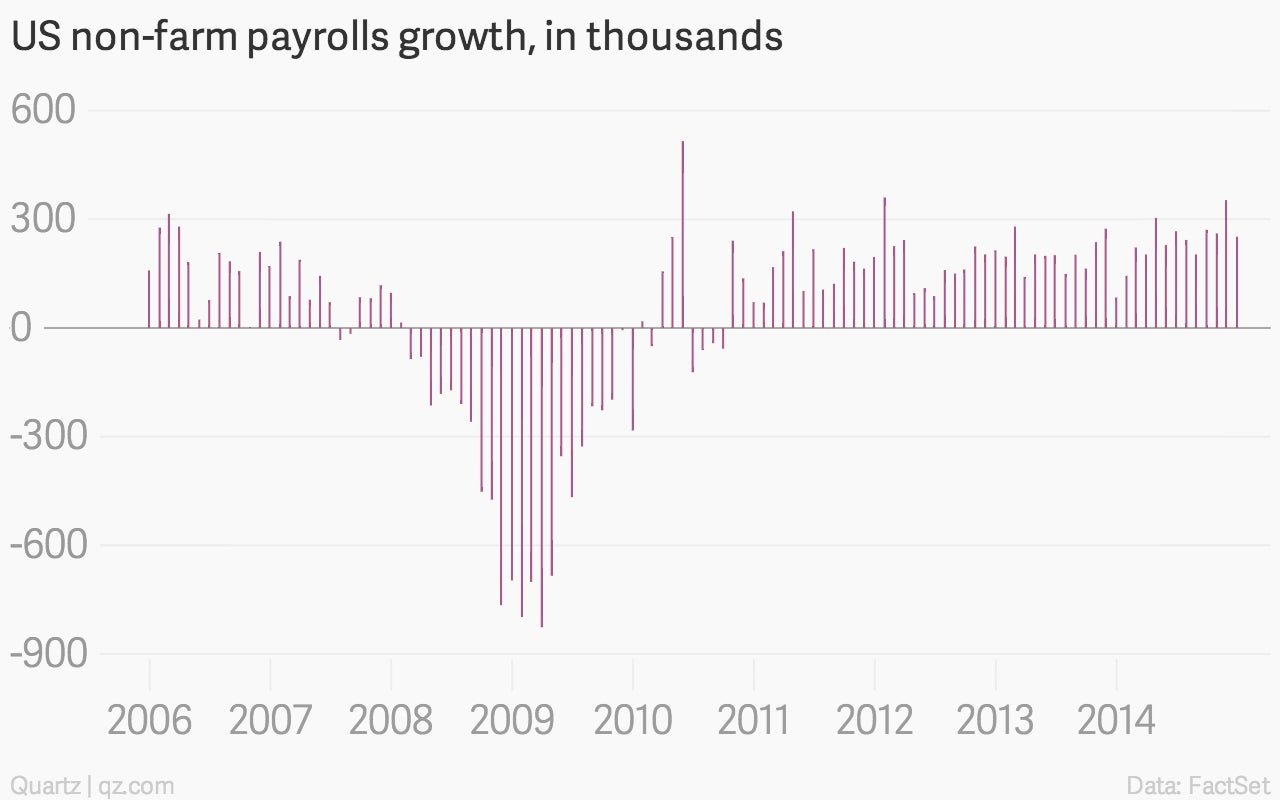
The US is experiencing solid job growth…
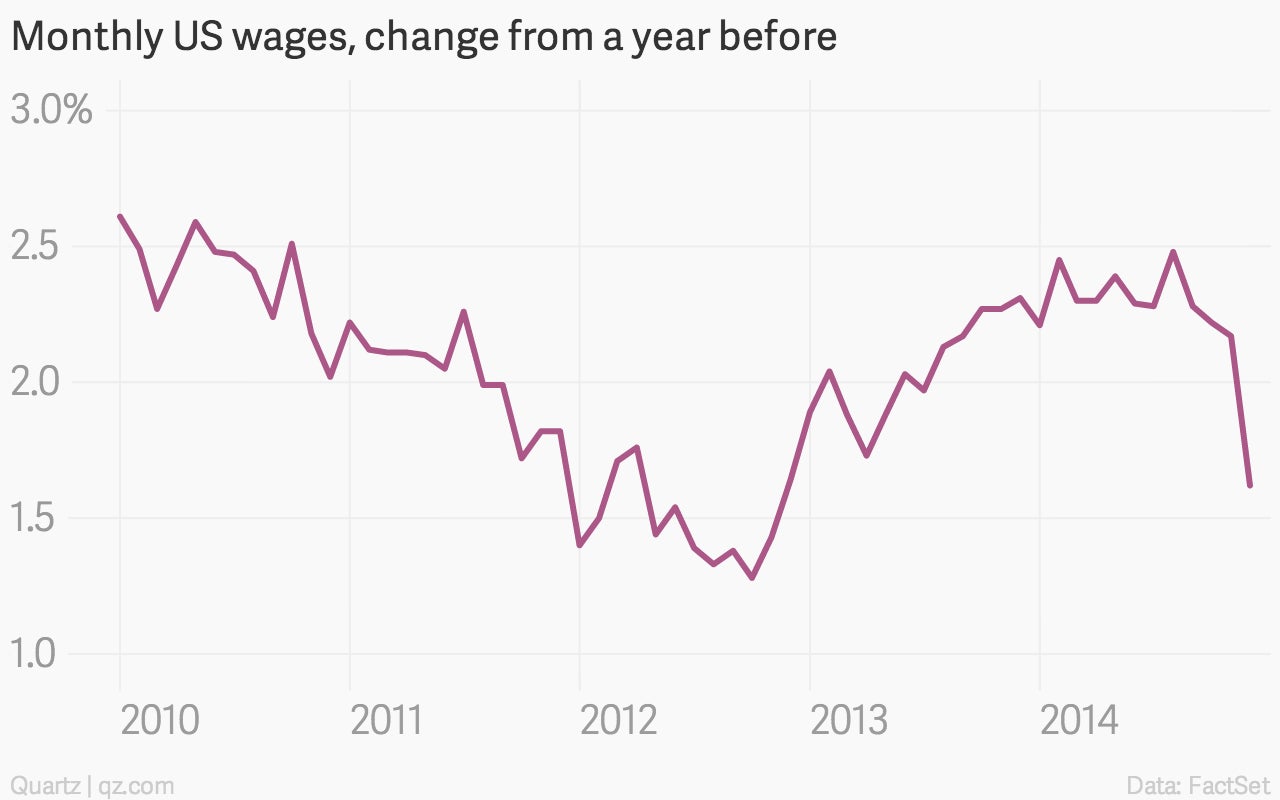
…but wages aren’t keeping up
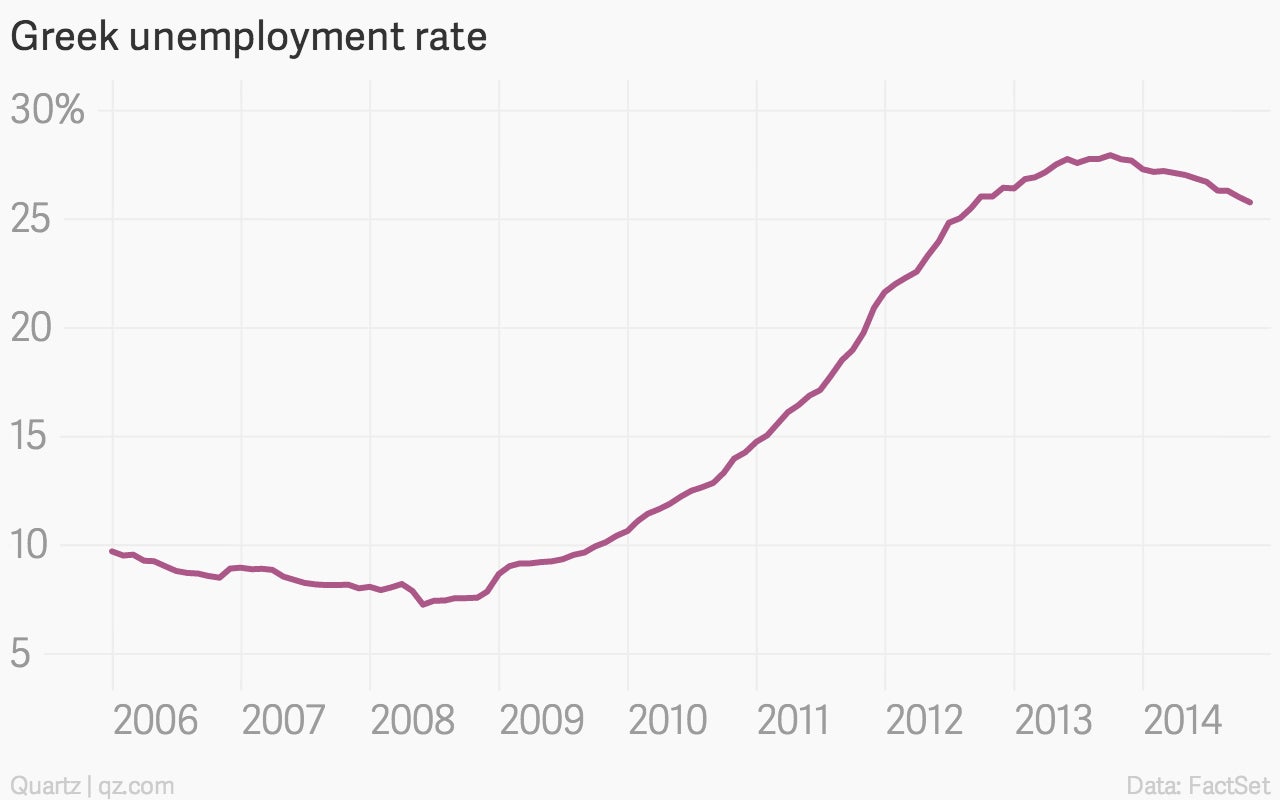
The Greek unemployment rate became a little less horrifying in October
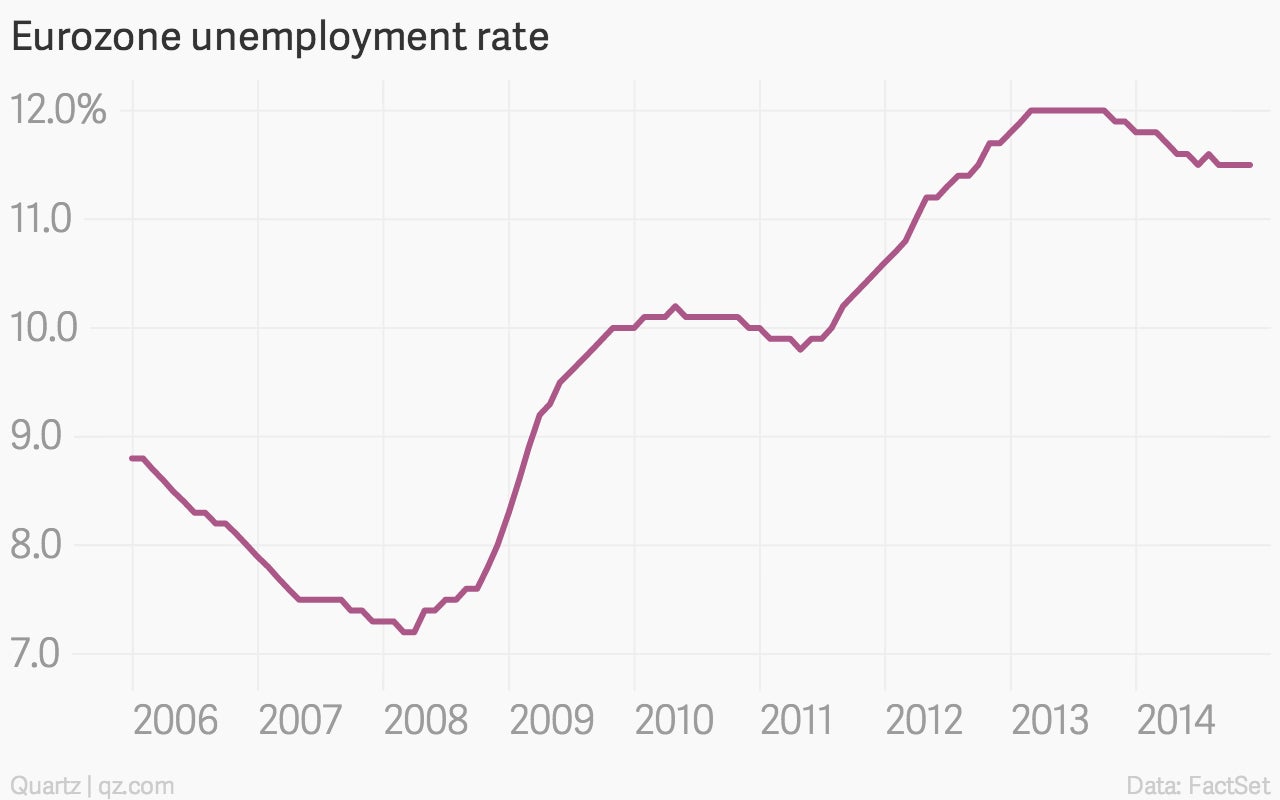
Eurozone unemployment was high, but stable
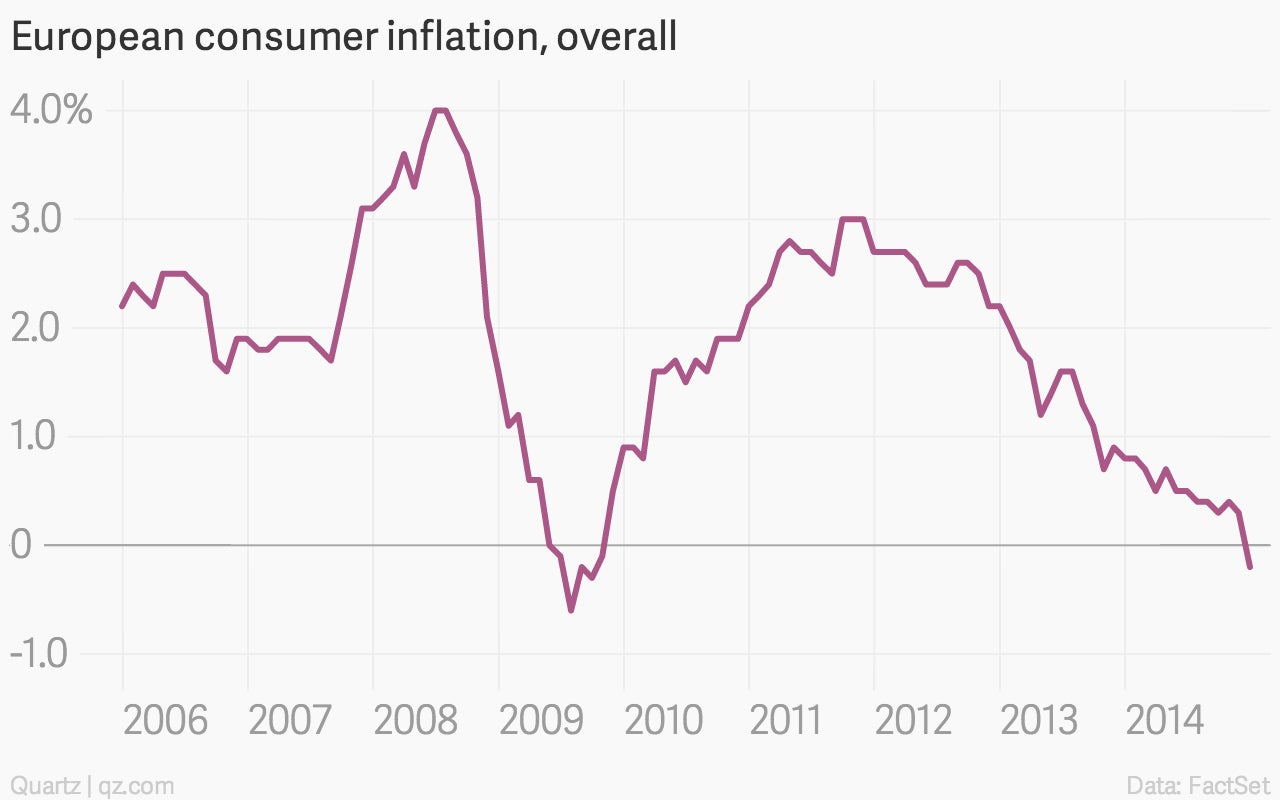
Eurozone inflation, on the other hand, turned into deflation
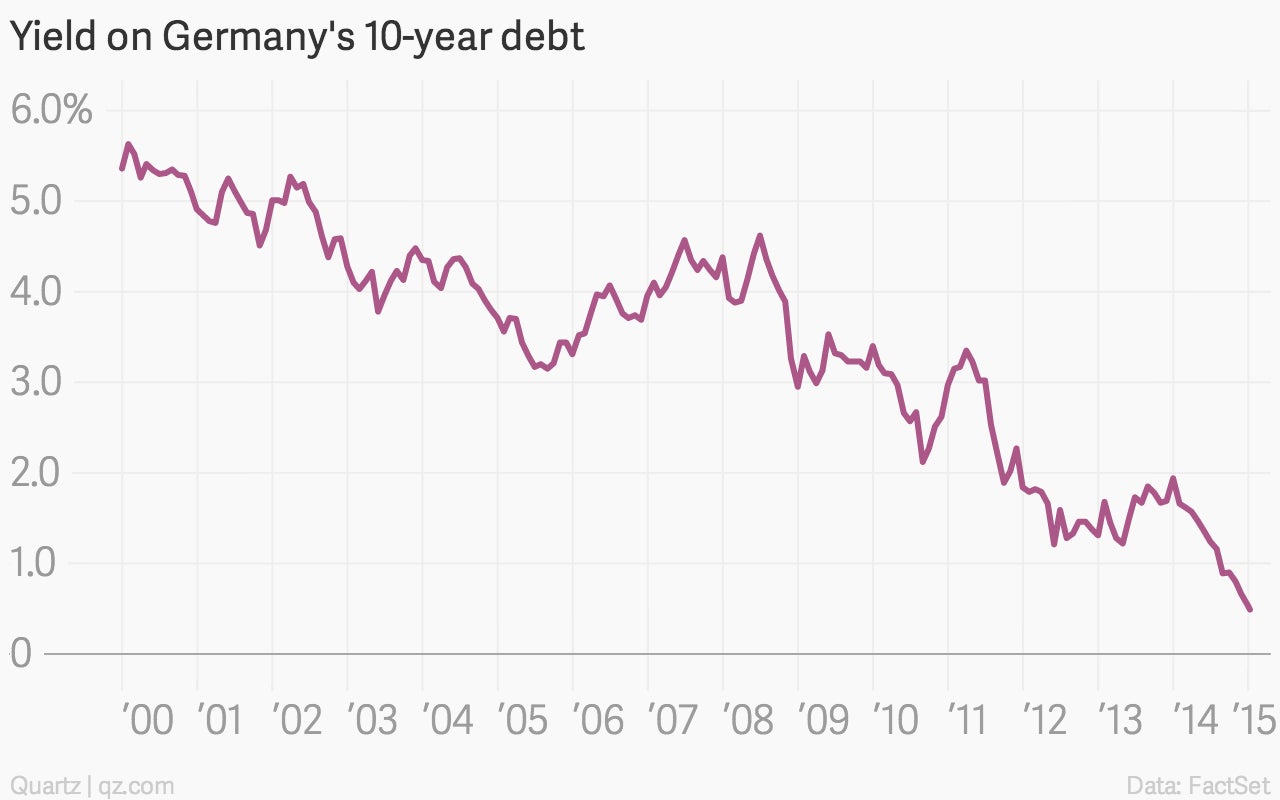
Germany’s 10-year bund is yielding a record low
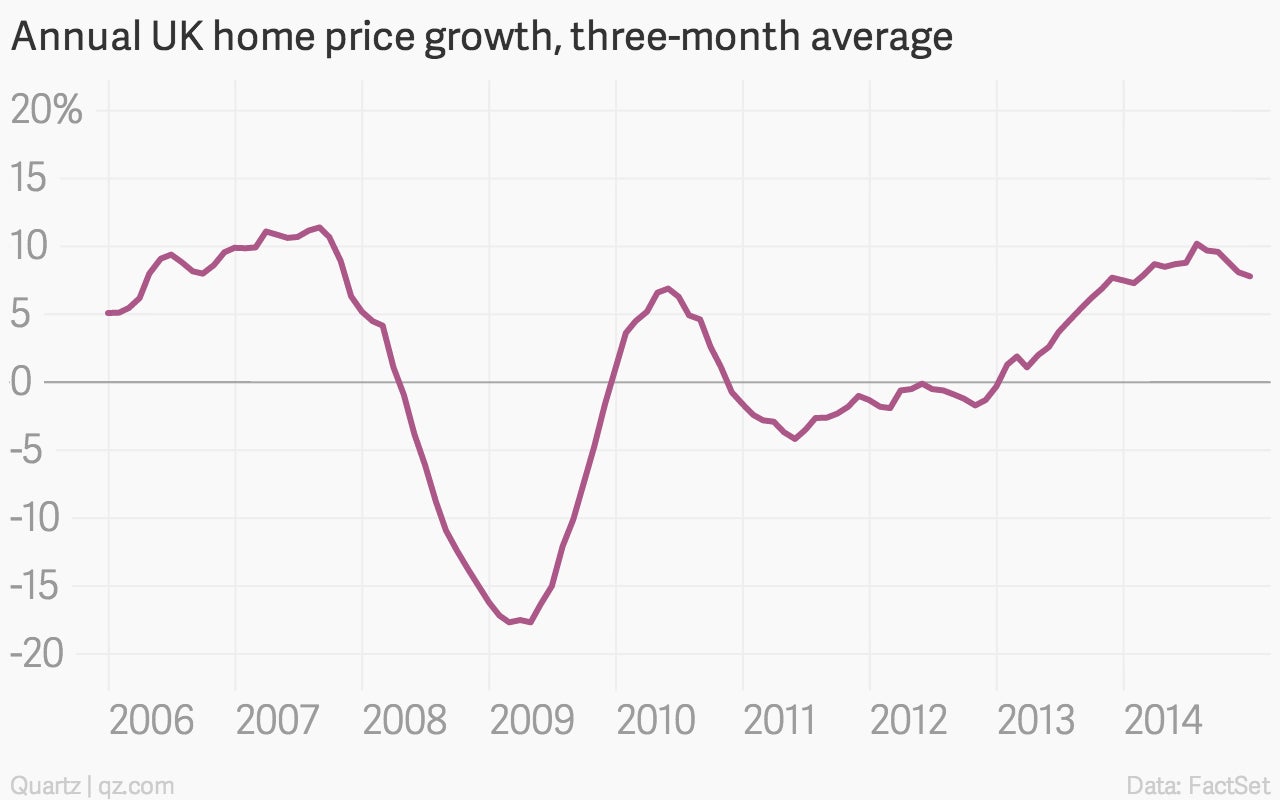
Home prices are stalling in the UK
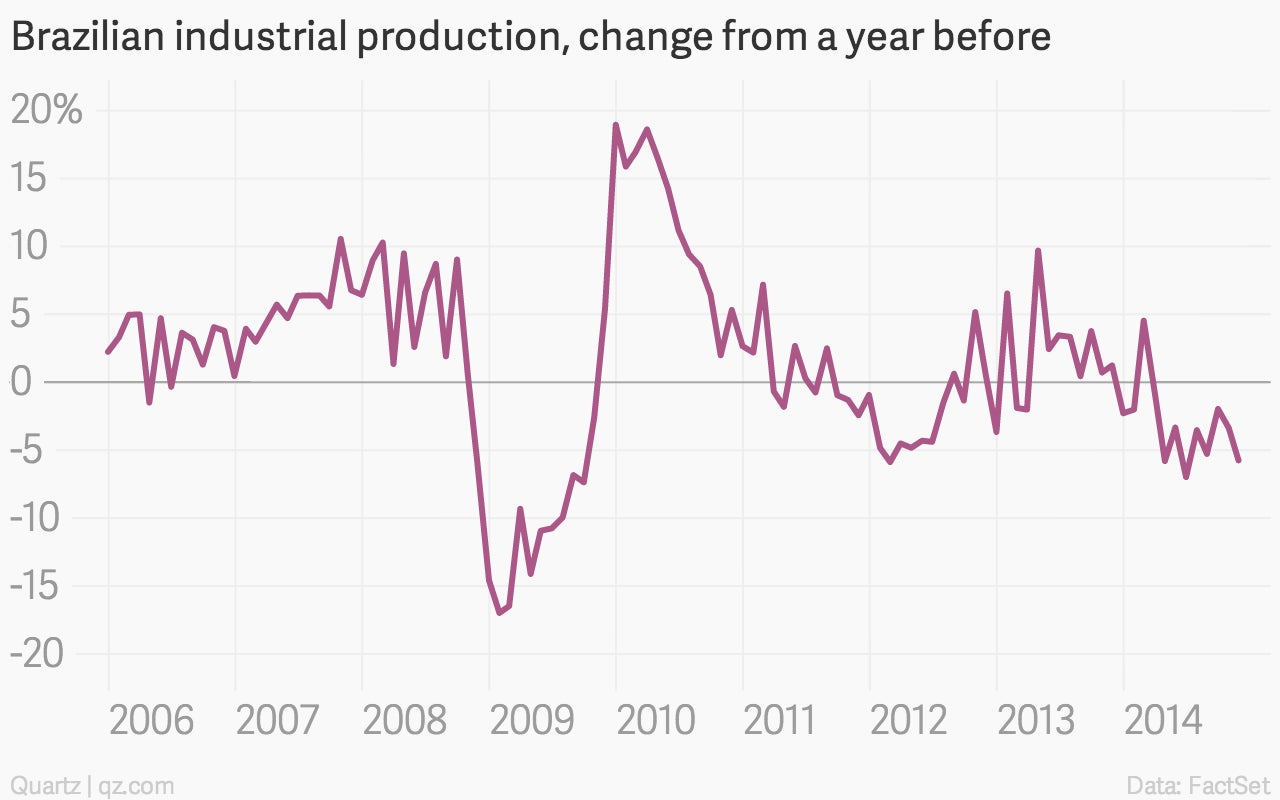
Brazil’s industrial production is falling
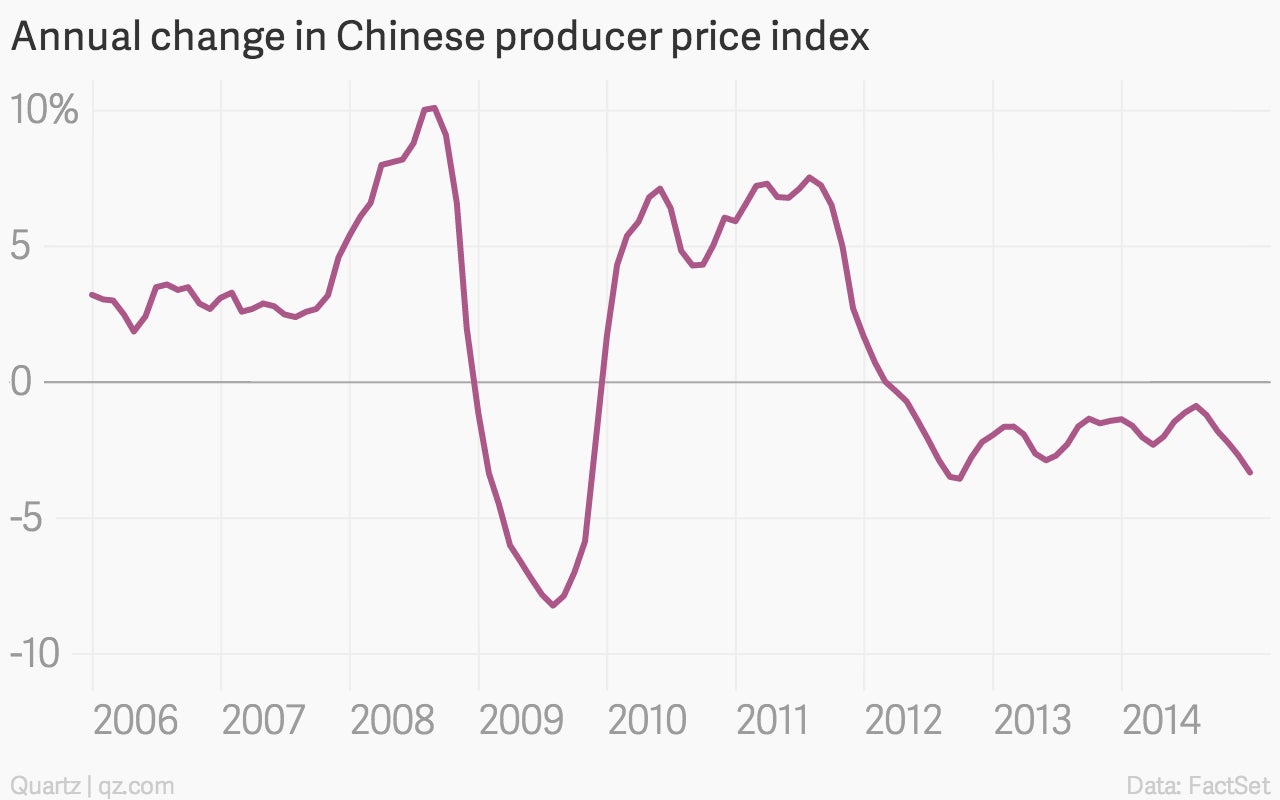
Chinese industrial prices are dropping at the fastest rate in half a decade
