The real story at Facebook over the past several years is one of execution. Many online companies knew that mobile was the future, but few have transitioned as impressively as Facebook, both in product and business:
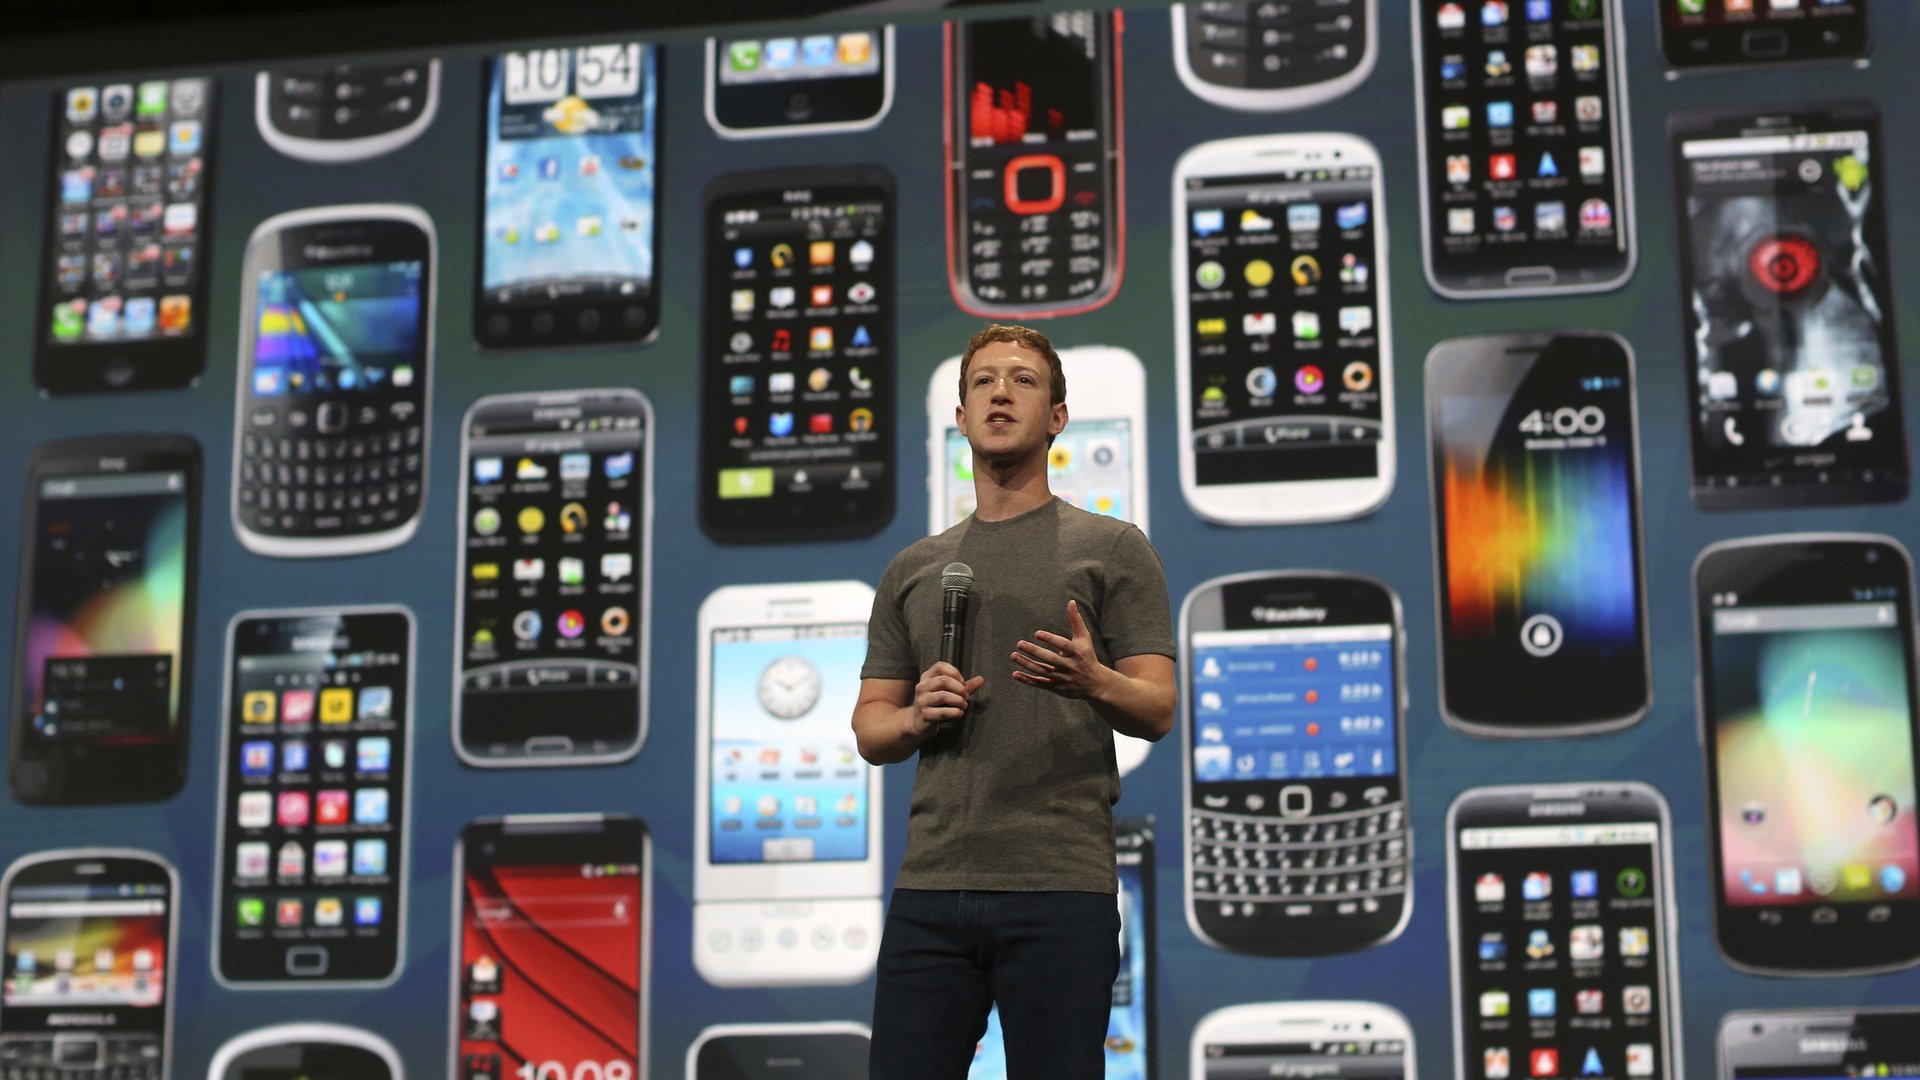
The real story at Facebook $META over the past several years is one of execution. Many online companies knew that mobile was the future, but few have transitioned as impressively as Facebook, both in product and business:
Join 500,000+ readers who start their day with Quartz.
By subscribing, you agree to our Terms of Service and Privacy Policy.
But here’s one chart that says it all, via long-time mobile industry watcher Benedict Evans, who is a partner at Andreessen Horowitz, the venture capital firm.
This shows Facebook’s mobile ad revenue per mobile daily active user (its most important audience measurement). Specifically, it shows that while Facebook’s mobile user base has exploded, it has learned how to build a business around that audience even faster.
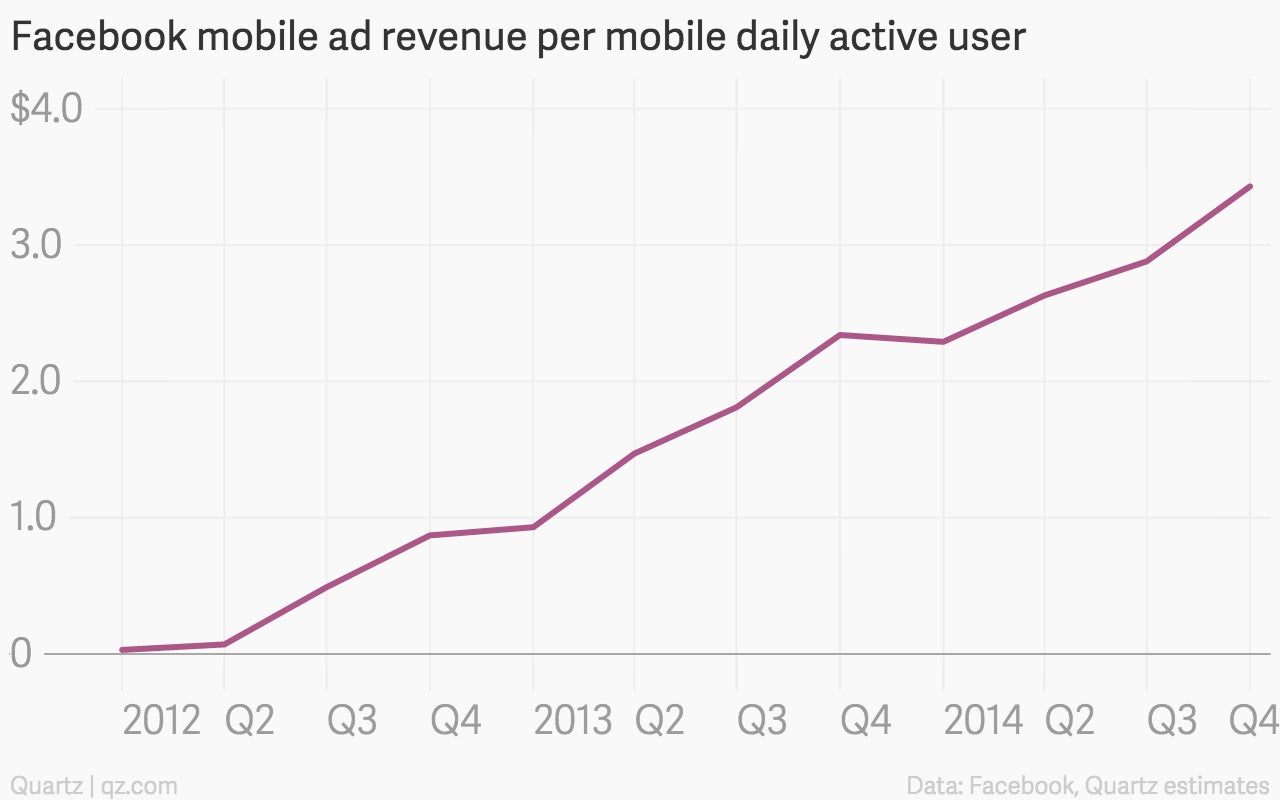
Evans tweeted a similar chart last night, noting: “Facebook: higher mobile engagement, better products, higher ARPU.” (Average revenue per user.)
In other words: Facebook is actually making it happen.