The 11 most important economic charts of the week
Germany and Greece are getting along better, which has done wonders for Greek stocks. But plenty of other chart-worthy stuff happened this week.

Germany and Greece are getting along better, which has done wonders for Greek stocks. But plenty of other chart-worthy stuff happened this week.
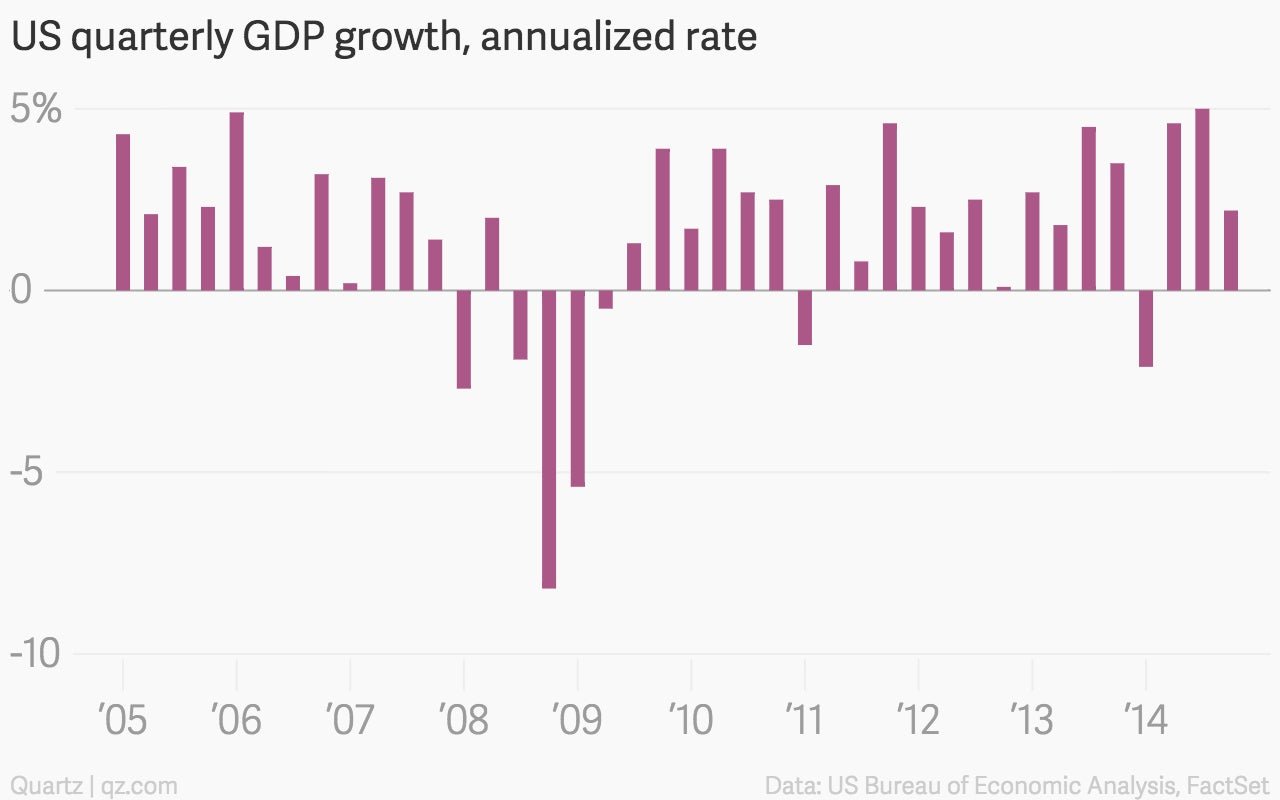
US economic growth slowed more than the government initially thought
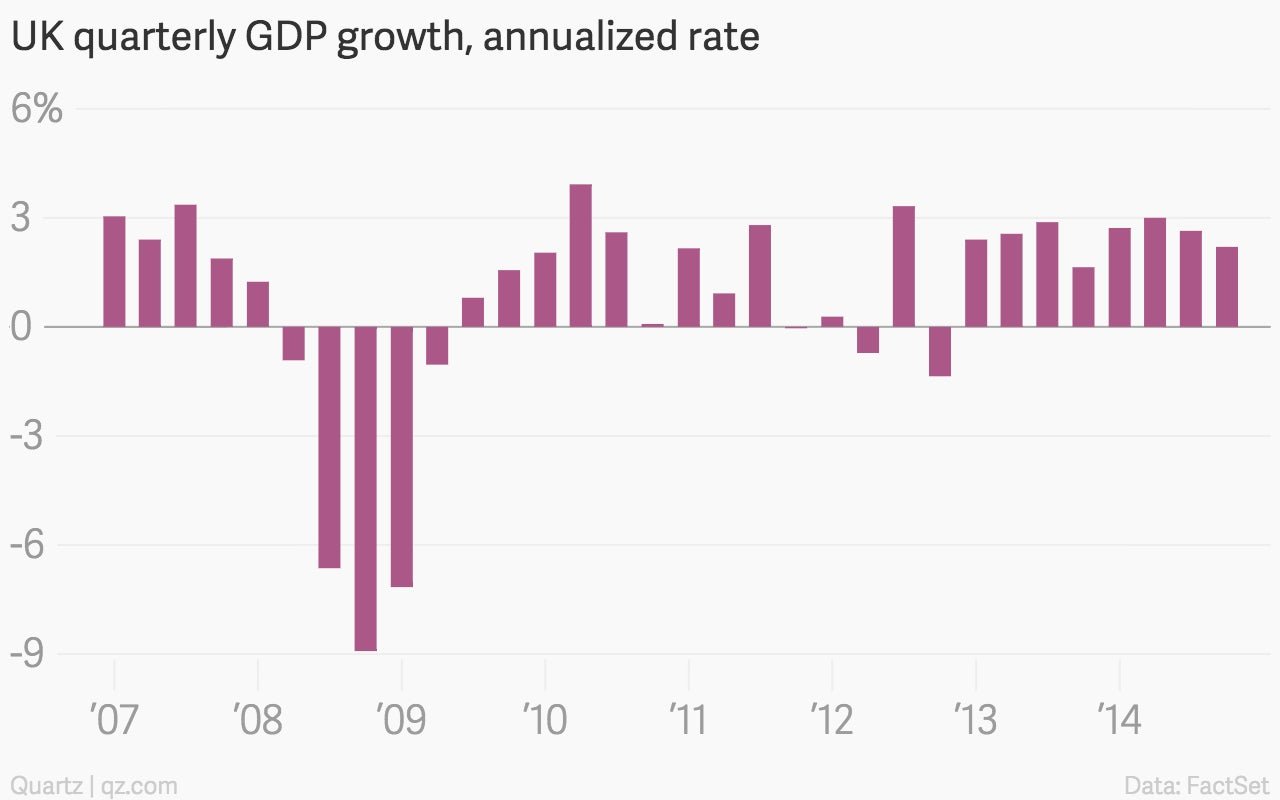
The UK’s GDP kept humming along quite nicely, oil sector troubles or no
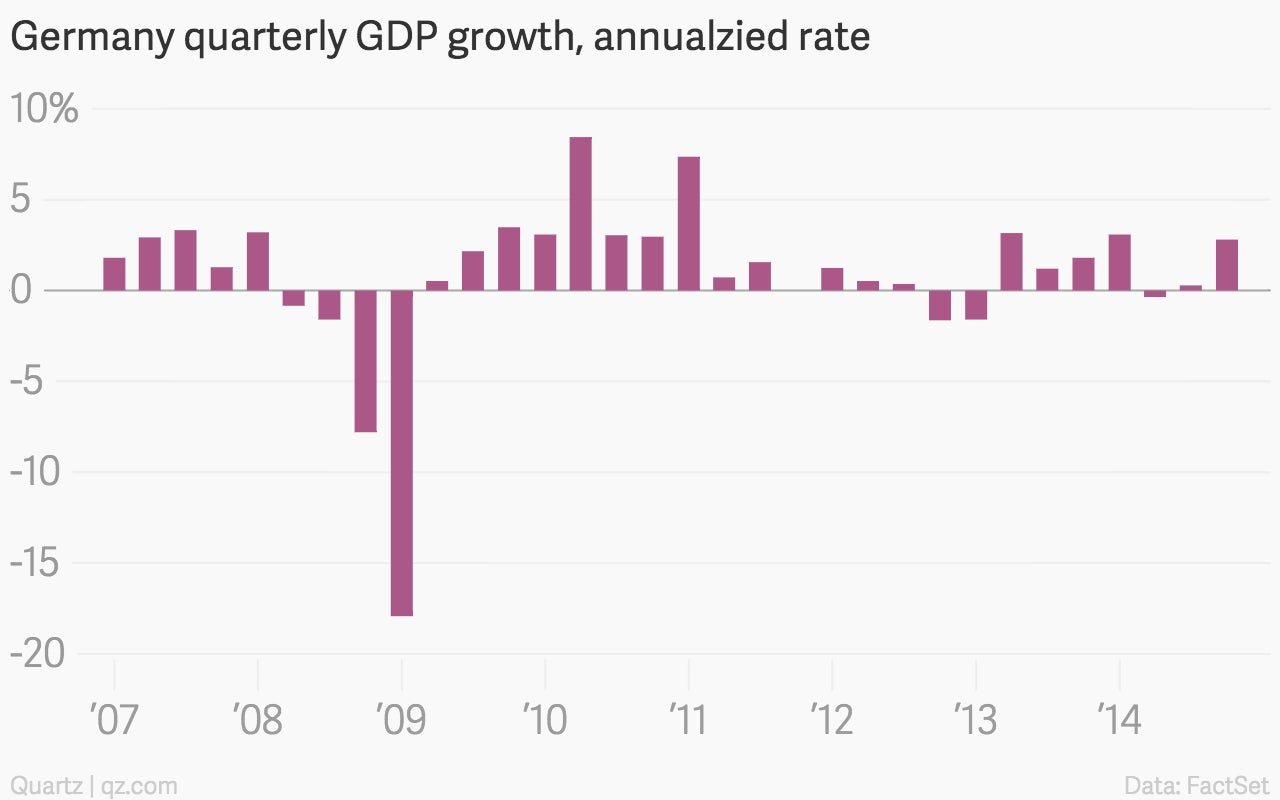
Germany’s economy bounced back from a couple of rough quarters
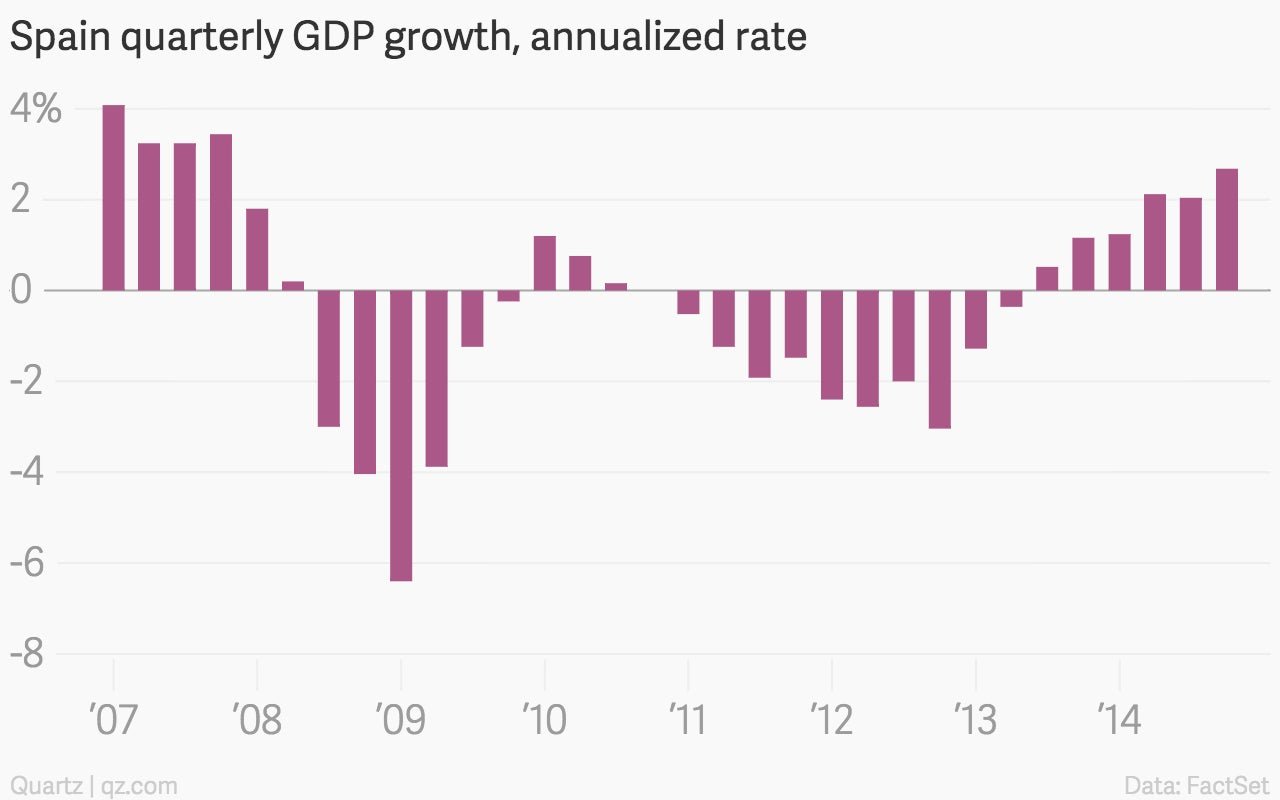
Even Spain is looking better
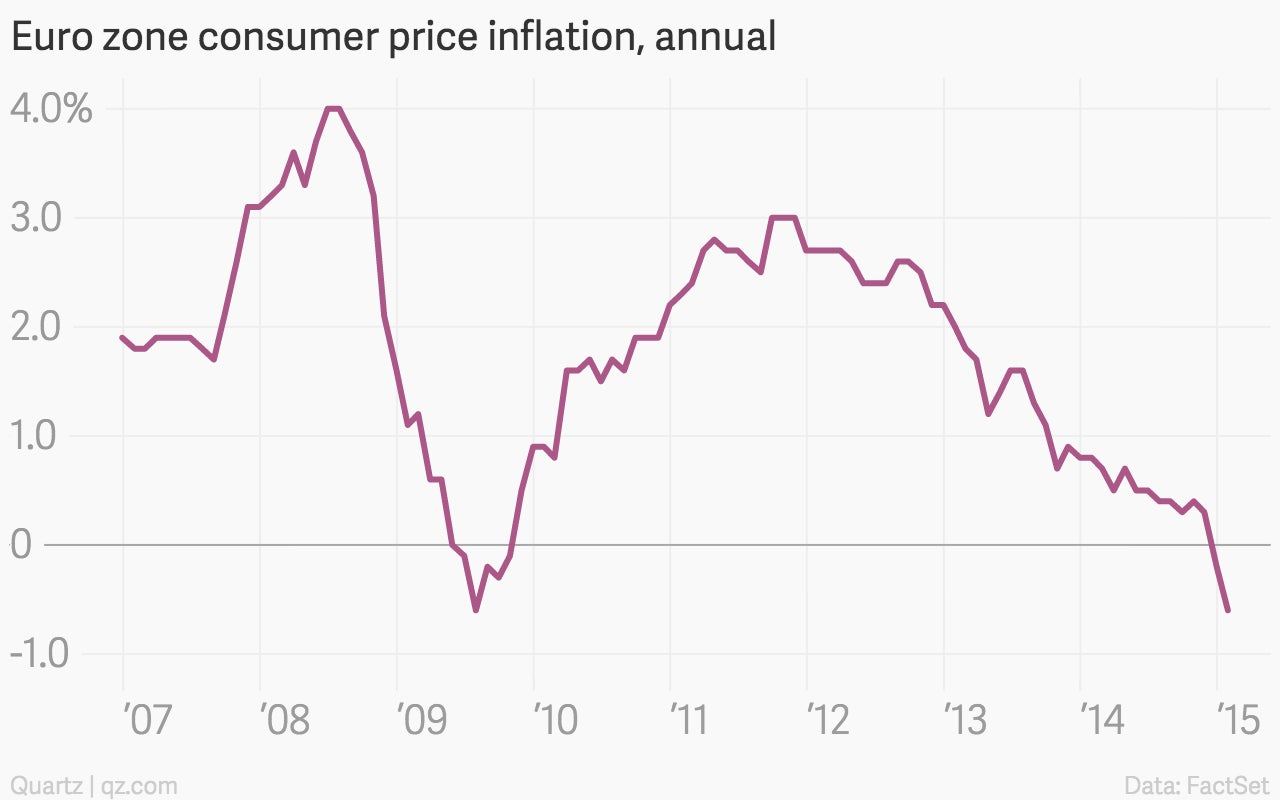
Euro zone-wide, (headline) deflation continued
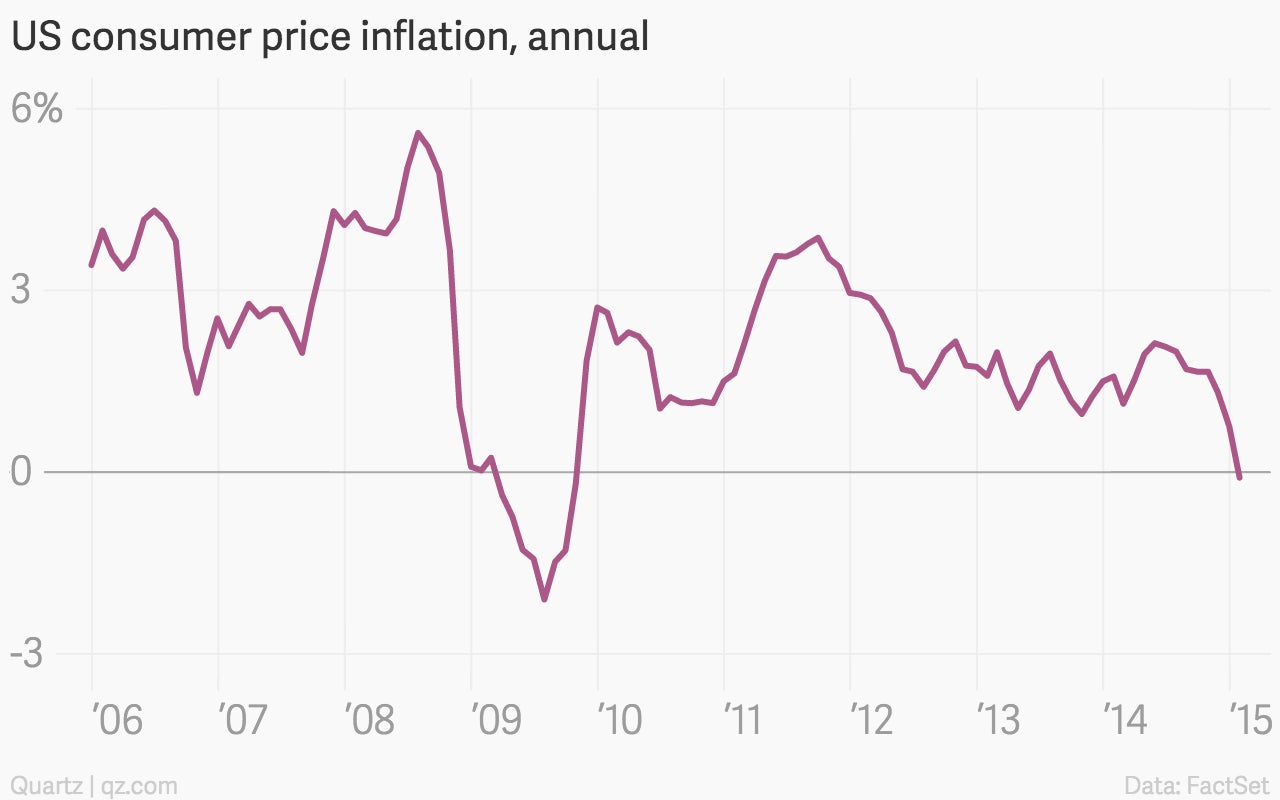
And the US joined in on the fun
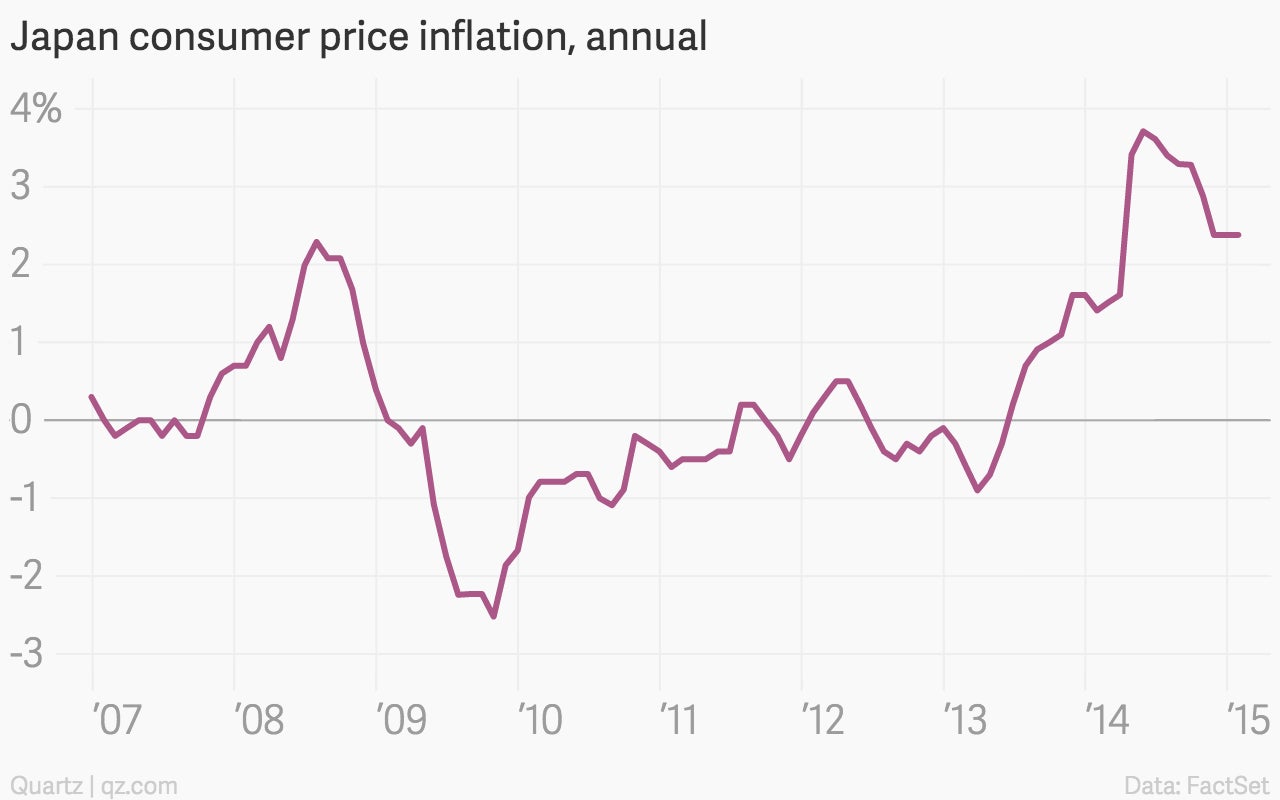
Even with a sales tax hike, Japan’s inflation spike continued to cool
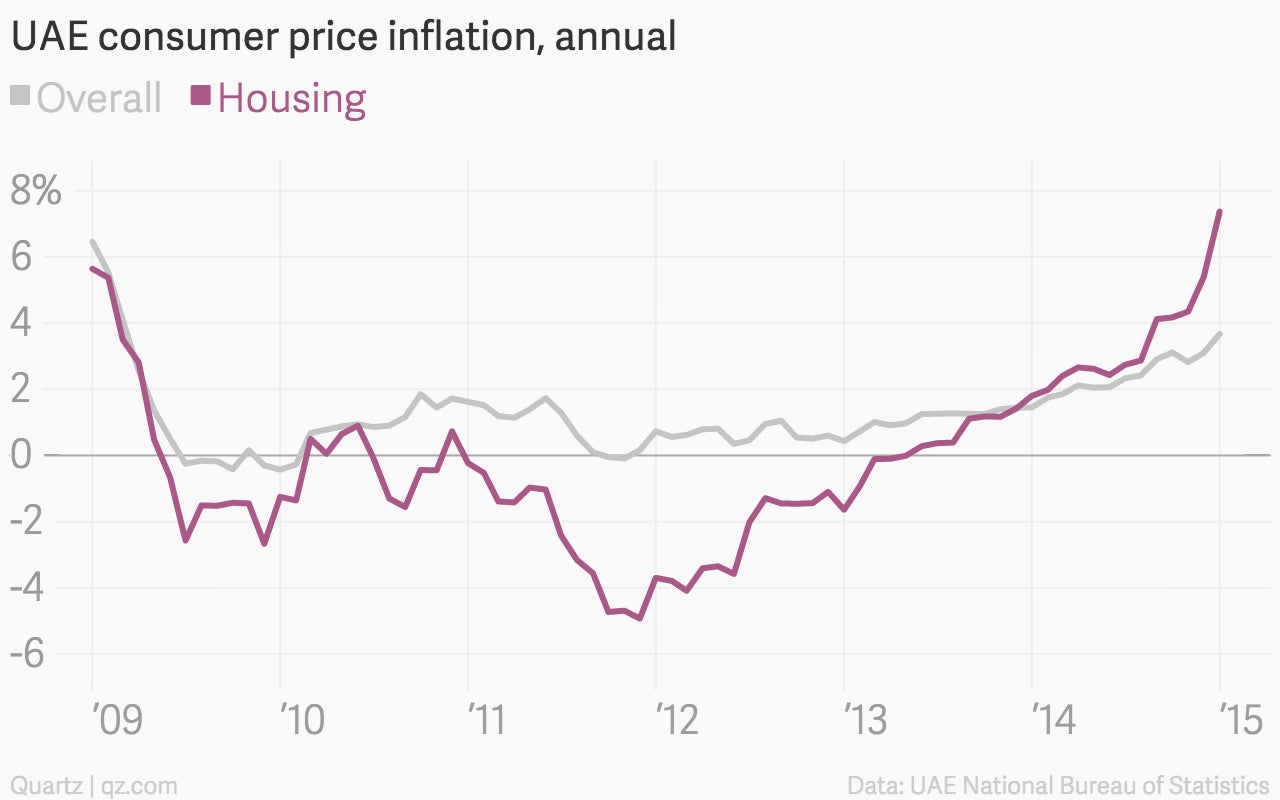
The UAE, on the other hand, had its biggest inflation jump since 2009, while housing prices kept surging
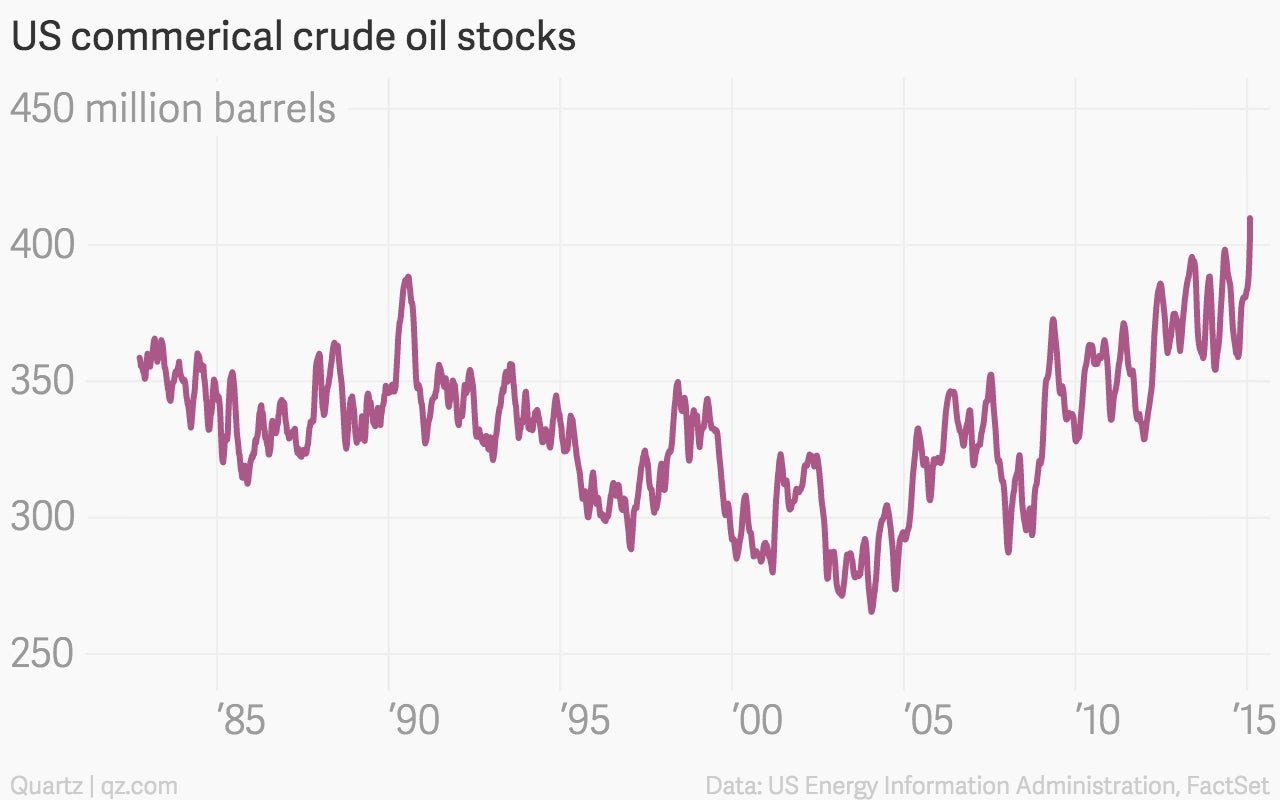
Speaking of oil-rich countries, US crude stockpiles continued busting records
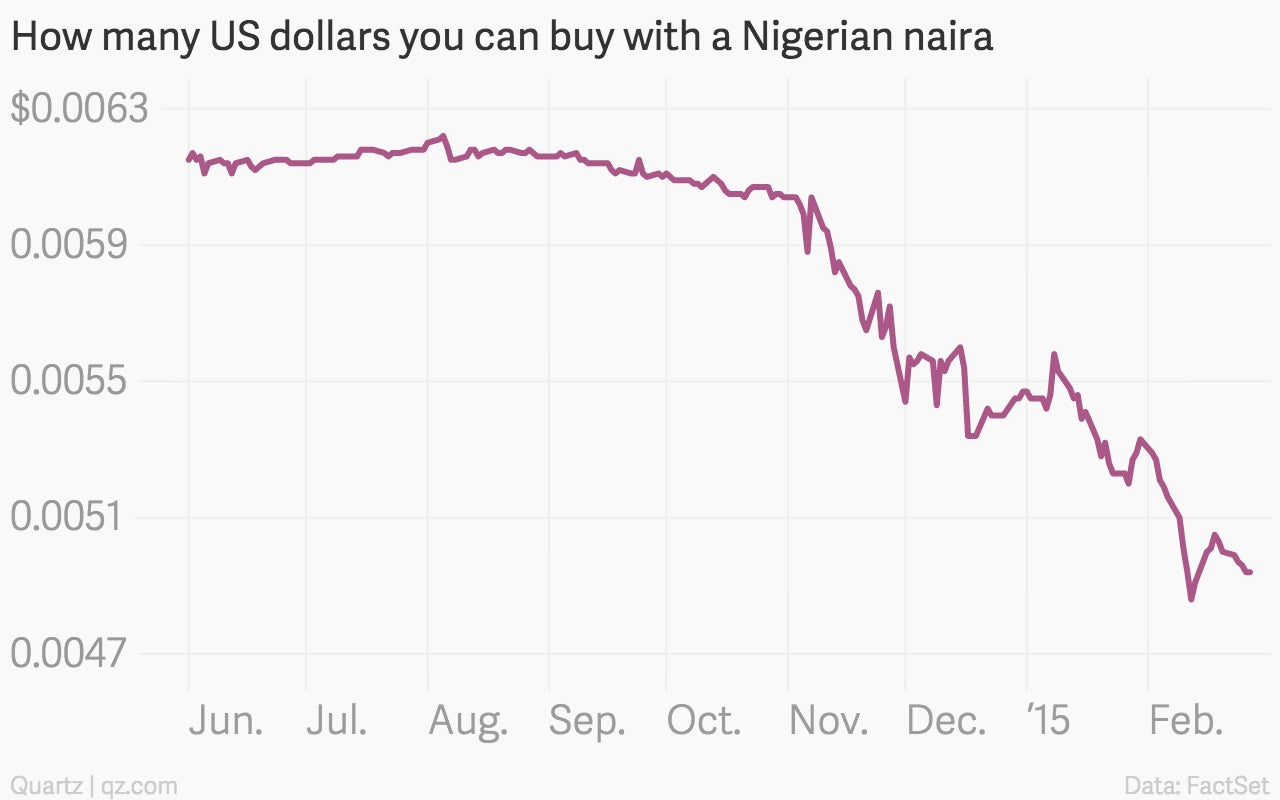
Higher oil prices couldn’t keep Nigeria’s naira from backsliding after the central bank devalued the currency for the second time in months
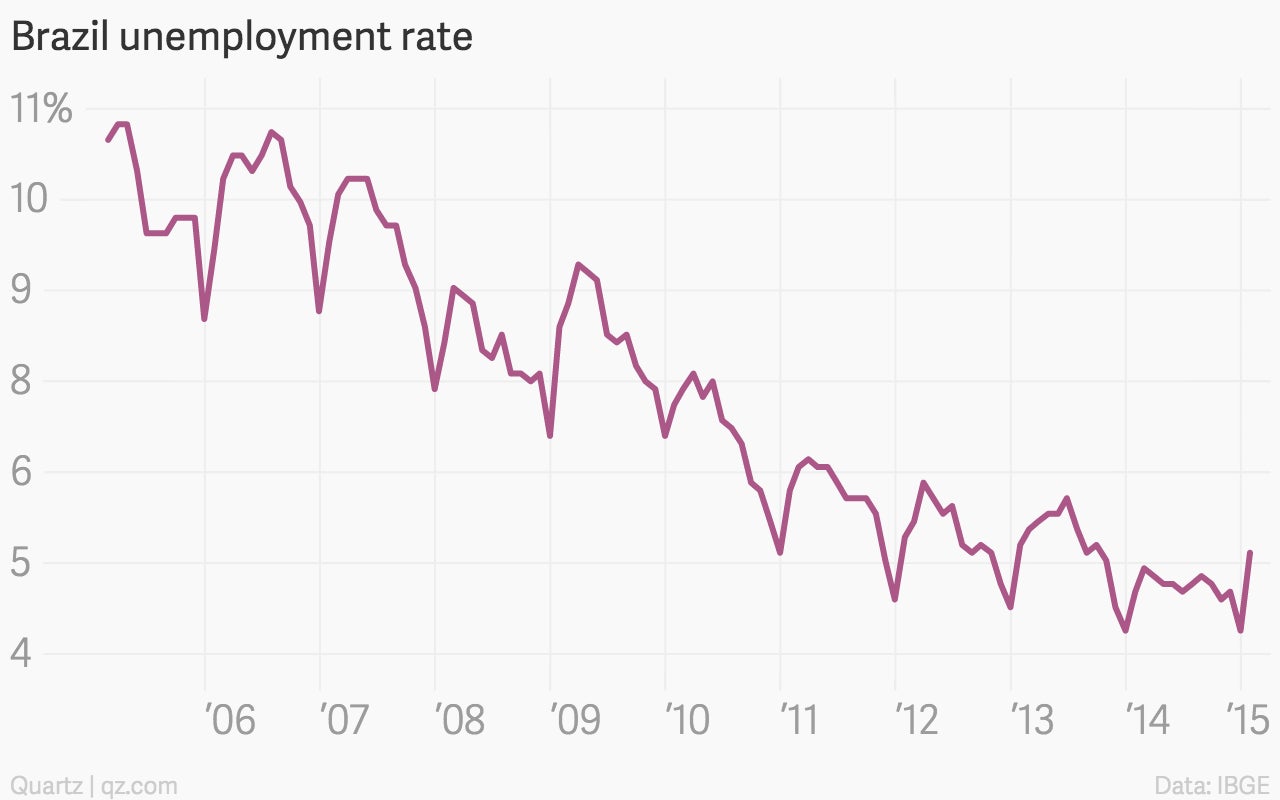
And Brazil’s unemployment rate is spiking after a long decline
