The nine most important economics charts of the week
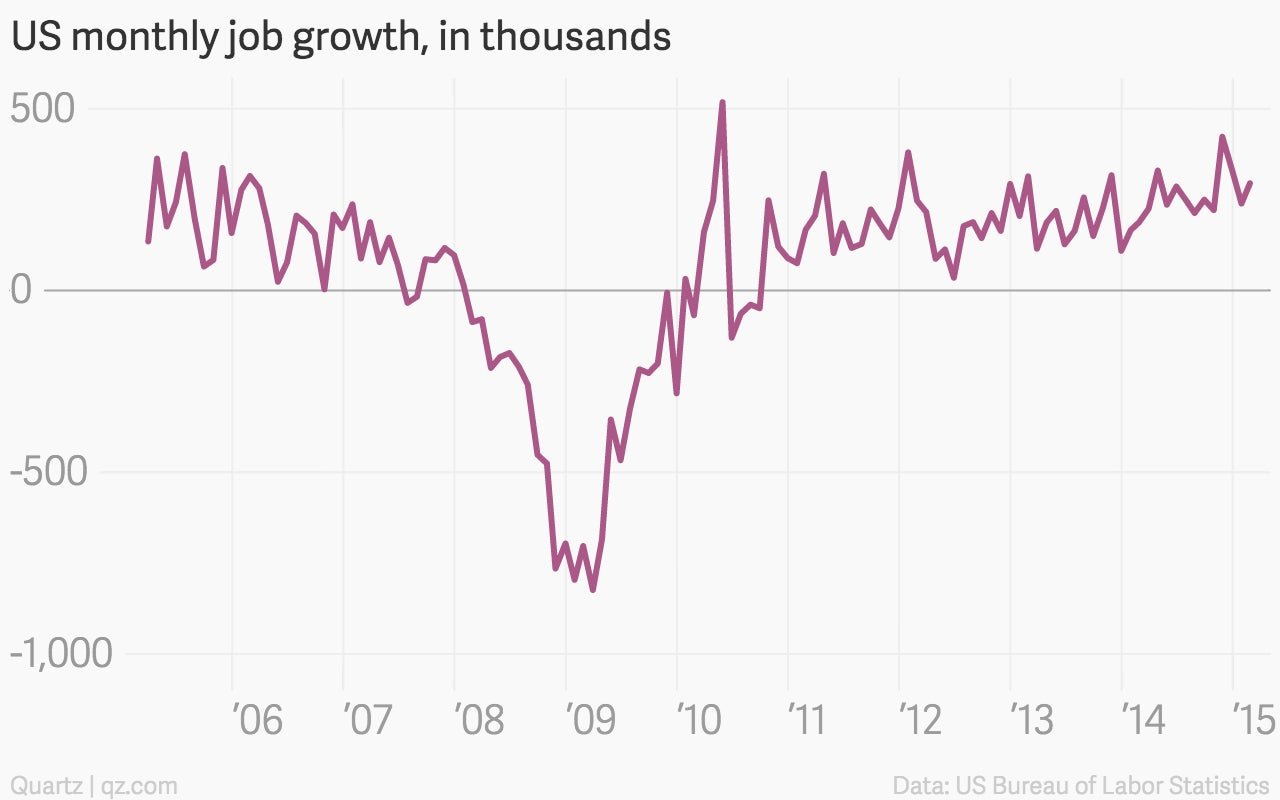
The US created 295,000 jobs last month.

The US created 295,000 jobs last month.
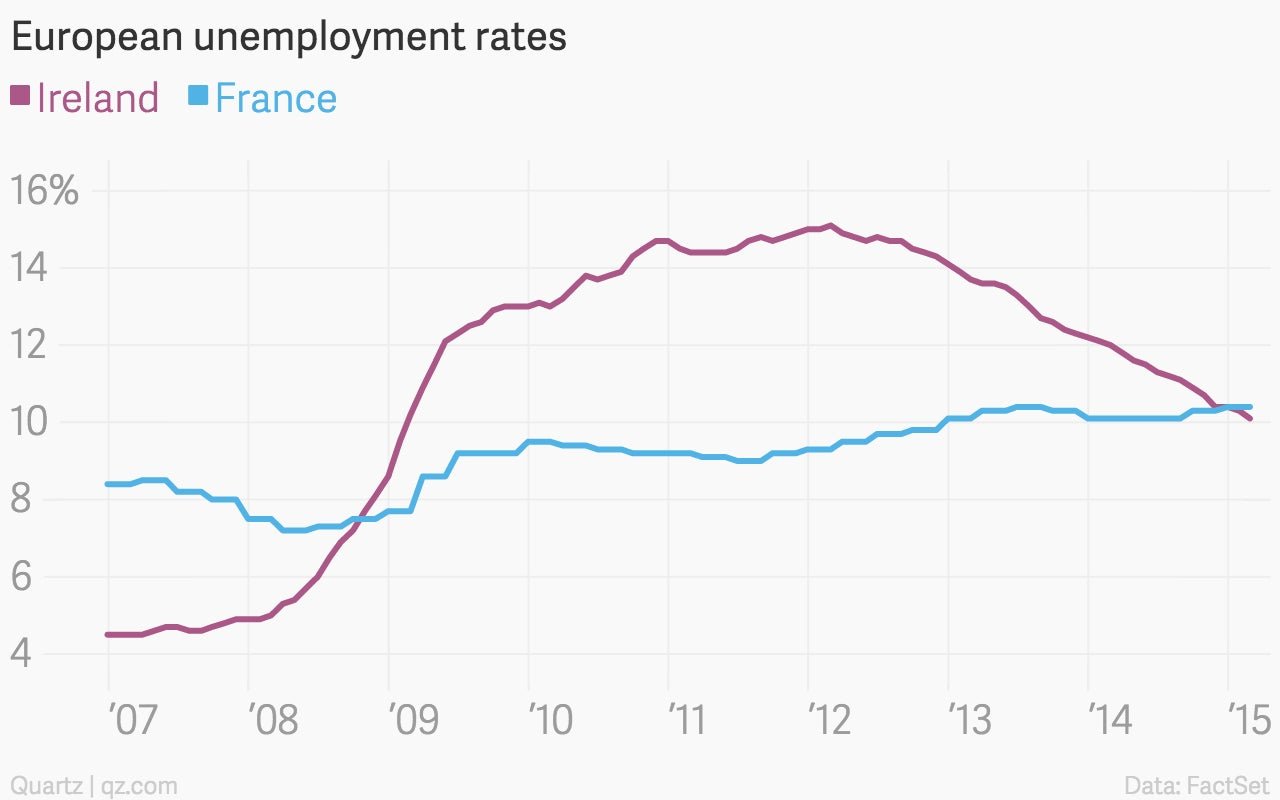
Speaking of jobs, Ireland’s jobless rate is lower than France’s for the first time since 2008.
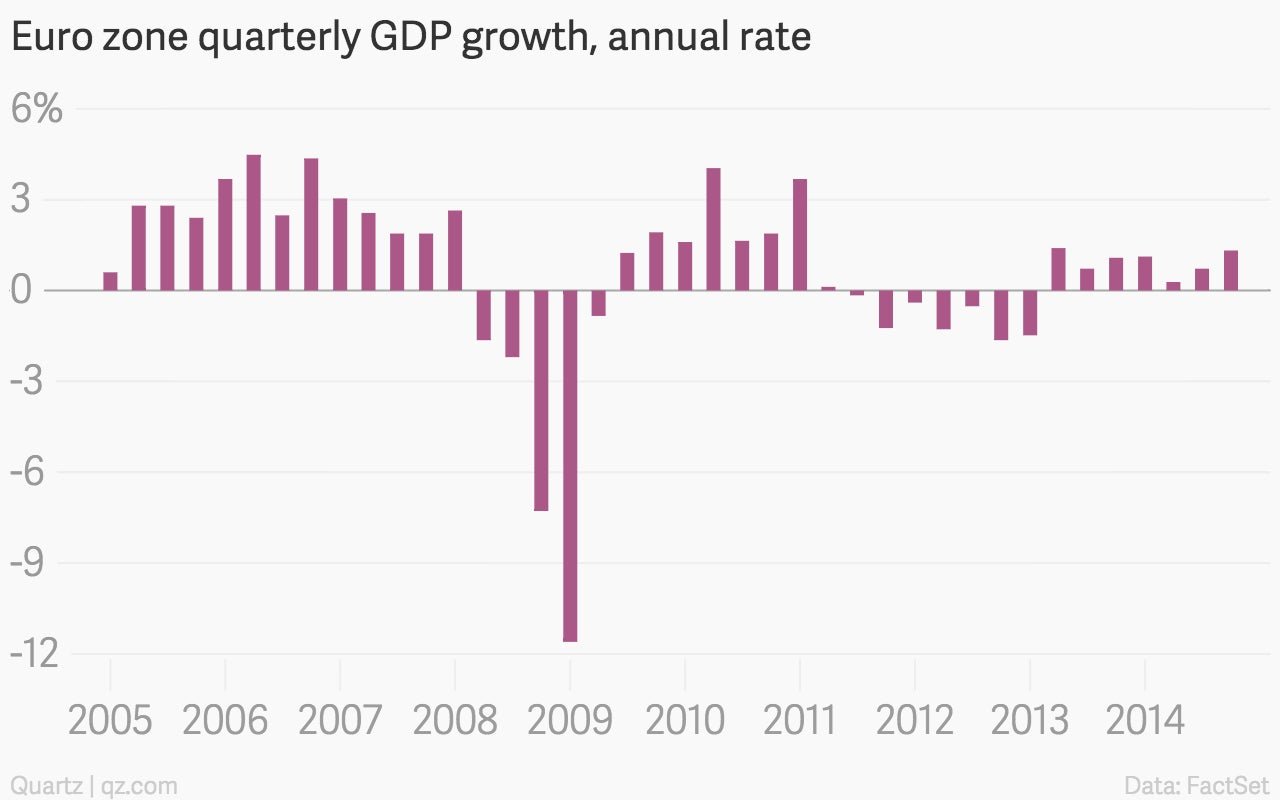
Euro zone economic growth is puttering along nicely…
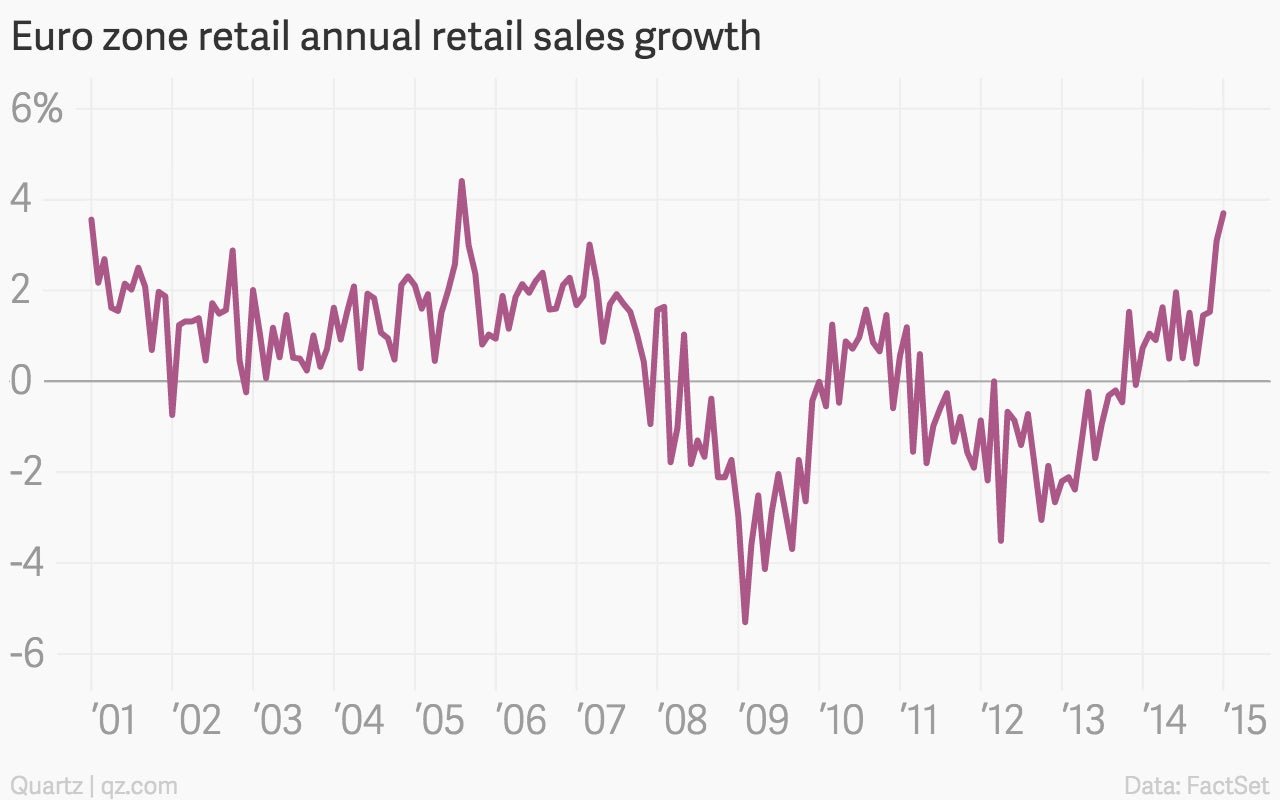
…and retail sales there are growing at their fastest rate in nearly a decade.
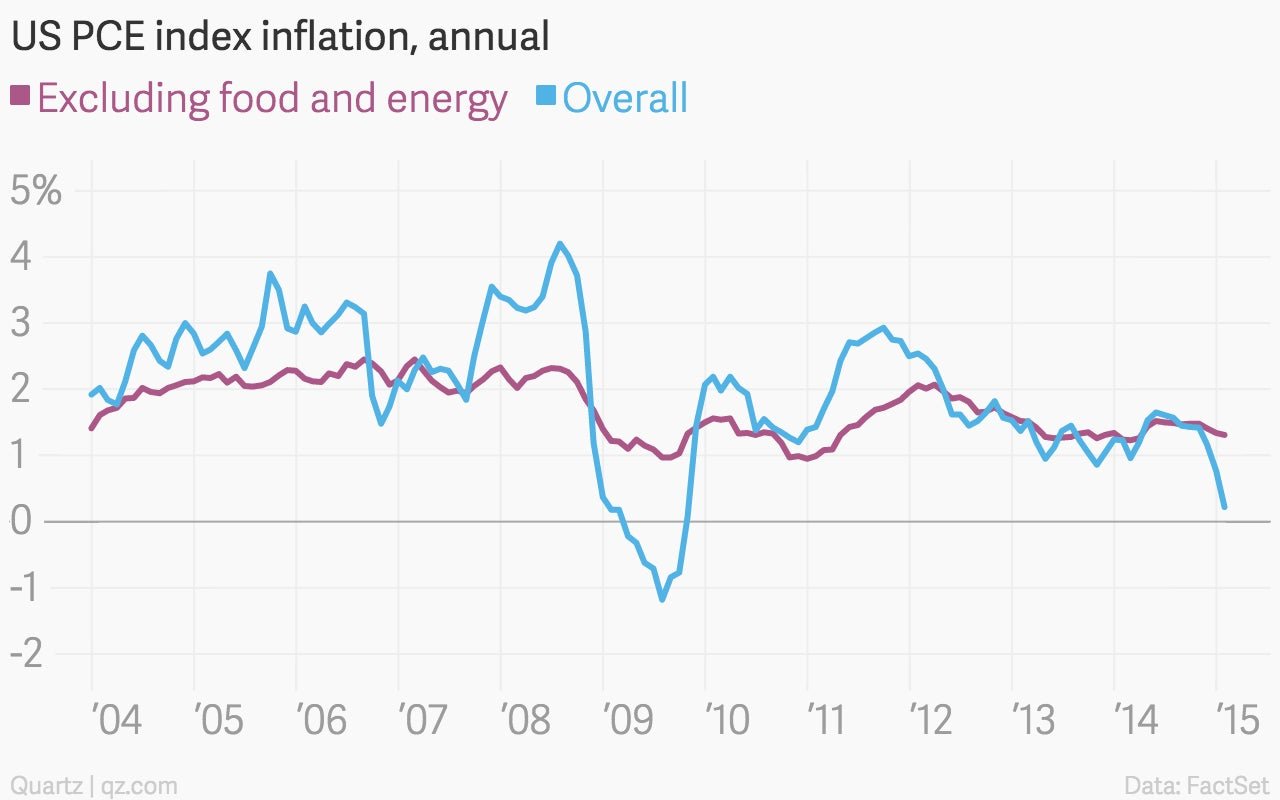
The Federal Reserve’s preferred core inflation measure is holding steady, even if the headline number is falling.
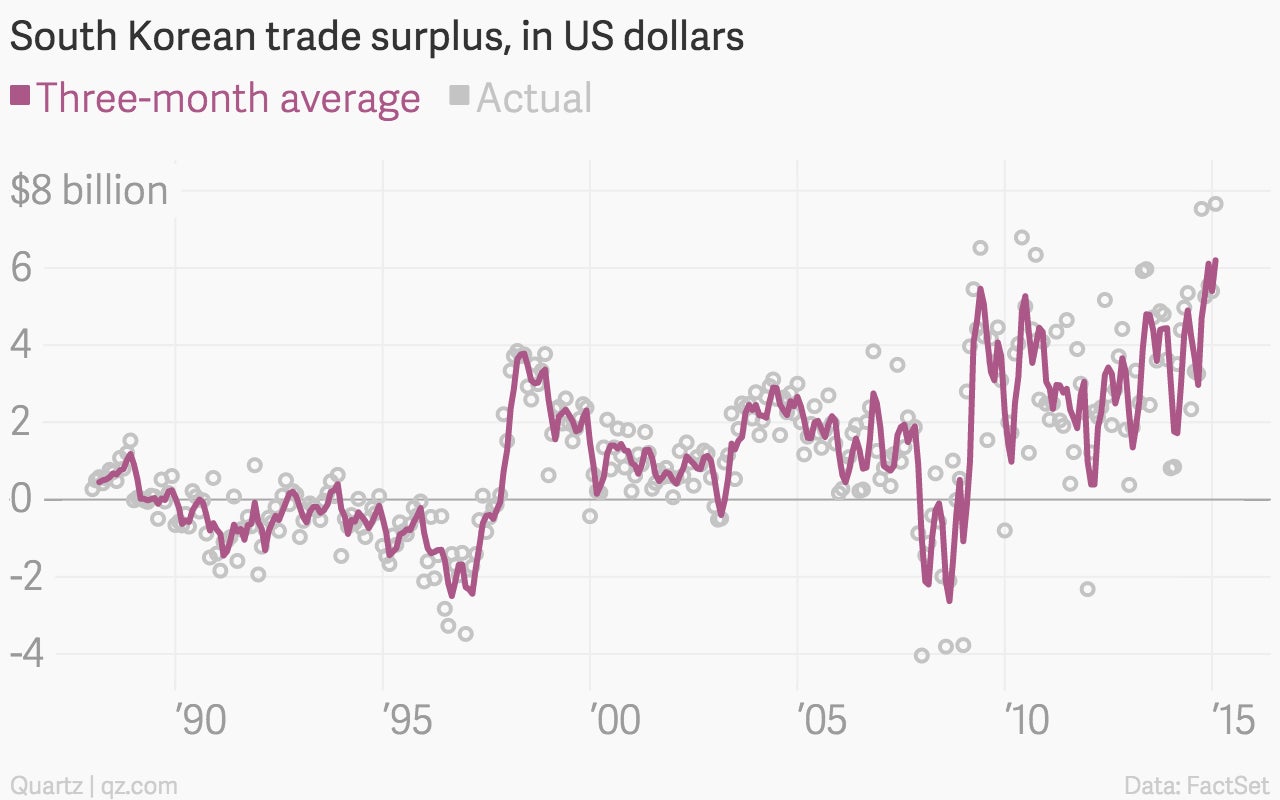
South Korea’s trade surplus is the highest it’s even been in some time as imports plummeted
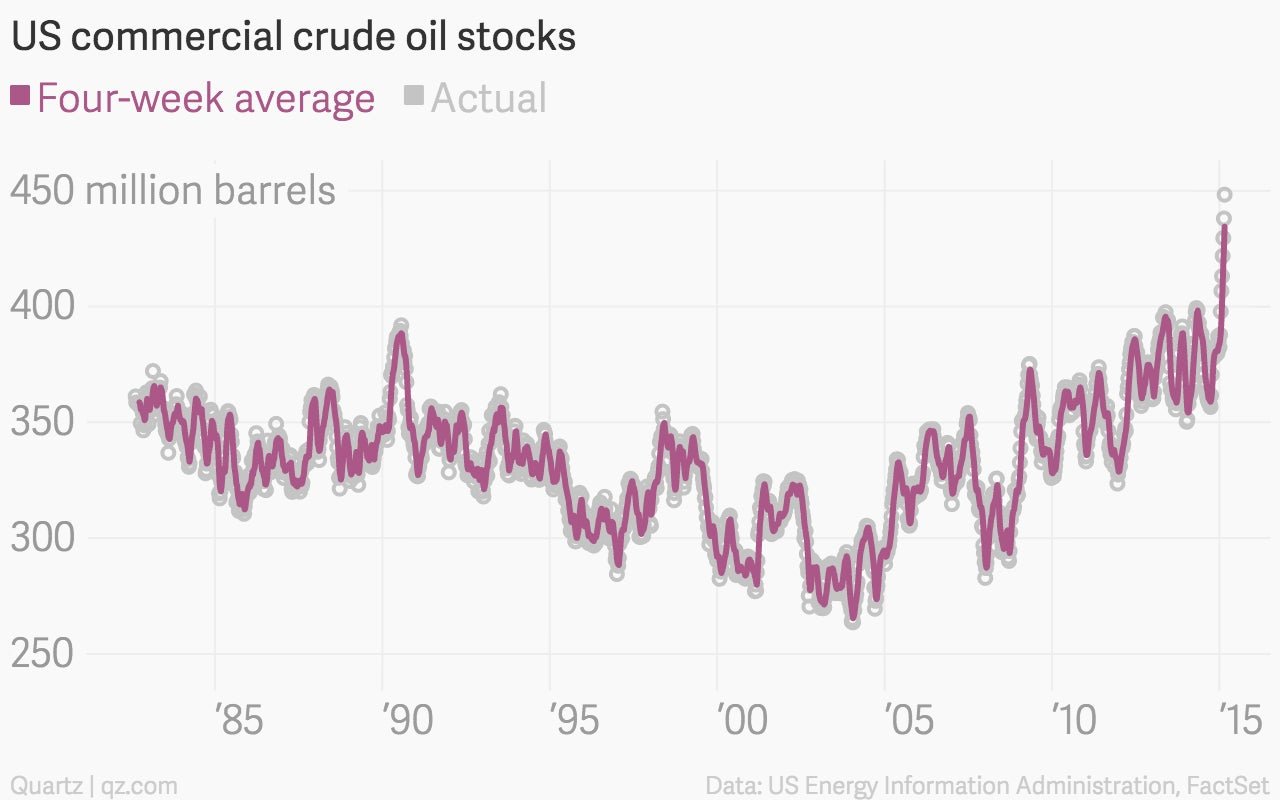
US crude oil stockpiles continue to climb to record highs, setting off worries about a storage shortage.
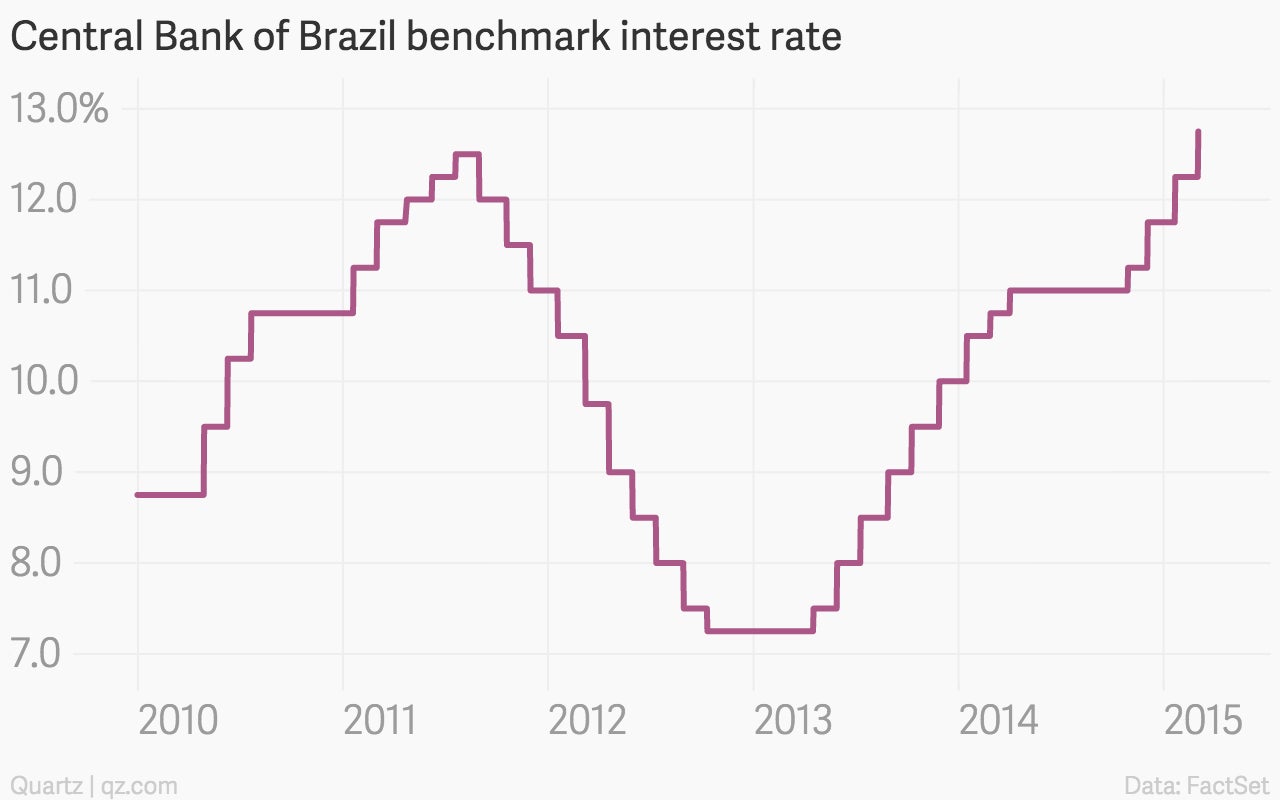
The Central Bank of Brazil hiked interest rates…
…though the real continues to weaken, reaching its lowest point in 10 years against the US dollar
