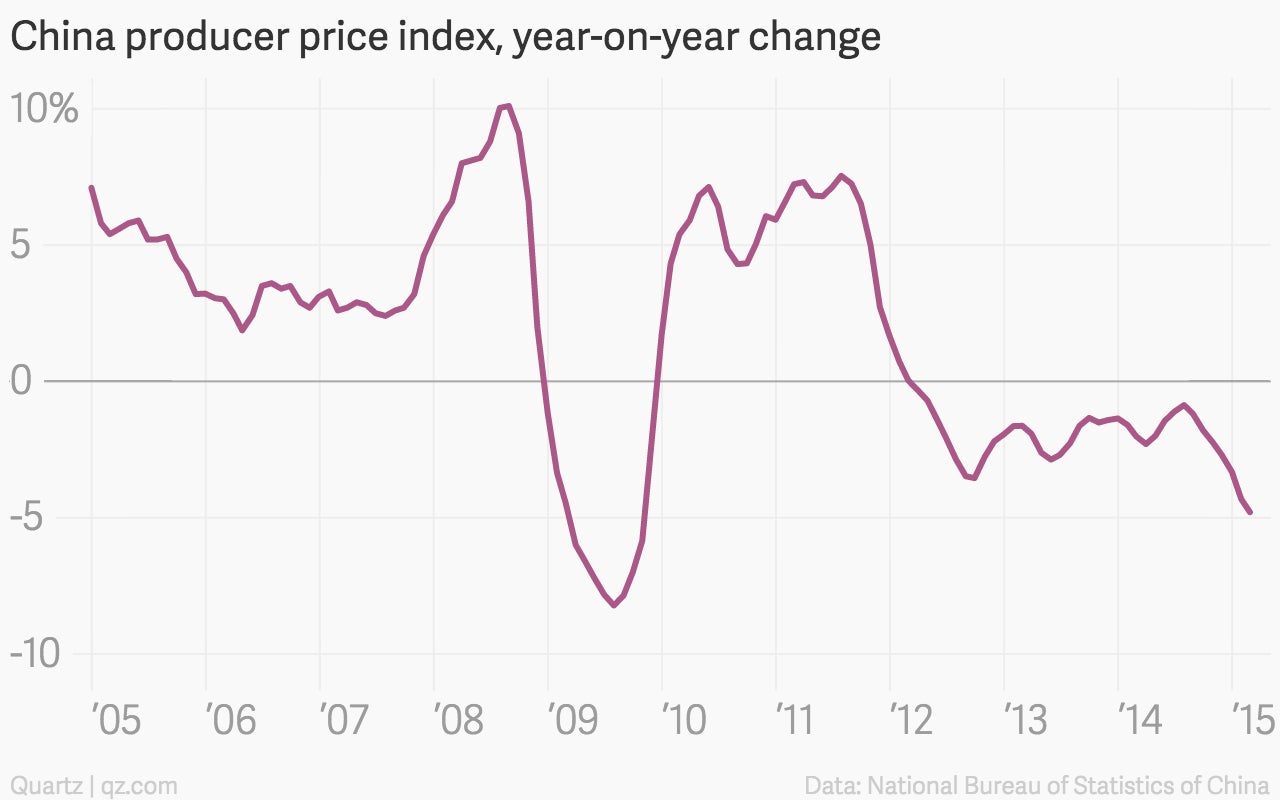
The obscure chart that’s the key to the global economy right now
The Chinese producer price index isn’t exactly the top of mind for most people keeping an eye on the global economy. But right now it should be.


The Chinese producer price index isn’t exactly the top of mind for most people keeping an eye on the global economy. But right now it should be.
The latest data shows that prices at the factory gate fell 4.8% in February, compared to February 2014. Obviously, that number betrays significant softness in the Chinese industrial economy. And seeing as China has been the industrial behemoth whose endless appetite for commodities drove up prices of raw materials for years, it makes sense to see sell-offs in industrial metals like copper and aluminum today as well as key commodity currencies such as the Australian dollar.

But the weakness in China also has important implications for the US where the Fed is apparently shrugging off a steep slowdown in prices in order to finally start raising interest rates sometime this year. The Fed thinks the weakness in prices—the US just slipped into deflation for the first time since the Great Recession—is largely due to the sharp downturn of energy prices over the last year. It probably is.

But the Chinese data underscores the fact that there is also persistent weakness in some of the world’s largest economies. And with Chinese factory prices falling, and the dollar rising, that means the US is going to be importing significant amounts of deflationary pressures for the foreseeable future.
That means that the Fed’s expectations for prices to rebound quickly might be misplaced. By extension, that suggests raising rates too soon would be a mistake.