We’re in a bear market for American misery.
We’re in a bear market for American misery.
Of course, that’s only if you’re looking at the so-called “misery index.” During the stagflationary days of the 1970s and 1980s, the misery index—which is essentially inflation plus unemployment—became an oft-cited barometer of social discontent by politicians, pundits and economists.
Join 500,000+ readers who start their day with Quartz.
By subscribing, you agree to our Terms of Service and Privacy Policy.
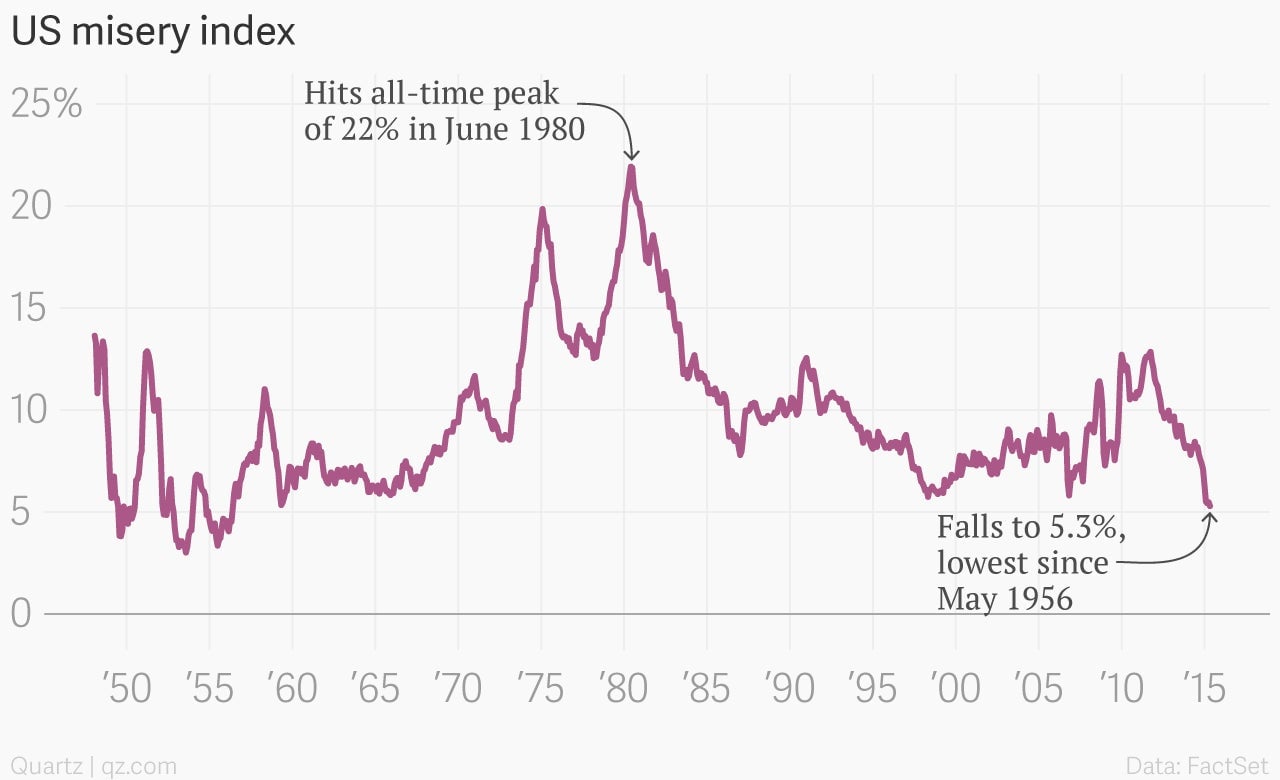
But in recent months, declines in both unemployment and prices—thanks to tumbling energy costs–have sent the misery index to the lowest level in more than a half century. (It was 5.29% in April, the lowest since May 1956, according to the data provider FactSet.)
Of course, as an economic gauge, this is not particularly telling. For example, according to the misery index, the early 1980s was the most miserable moment on record in recent decades.
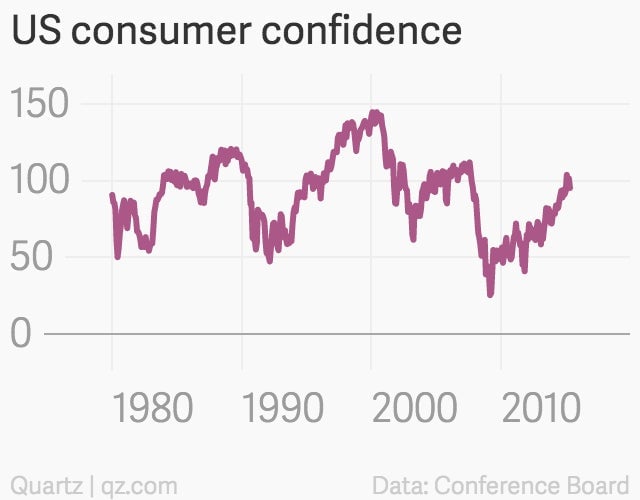
But if you look at consumer sentiment, Americans appeared to be far more miserable during the worst moments of the Great Recession in early 2009. And as you can see from the chart, right, the current absence of “misery” doesn’t necessarily translate into historically high levels of consumer satisfaction.
Indeed, the mood of American consumers remains well below the ebullient mood of the go-go 1990s, or even of the good times that eventually ended with the financial crisis of 2008.