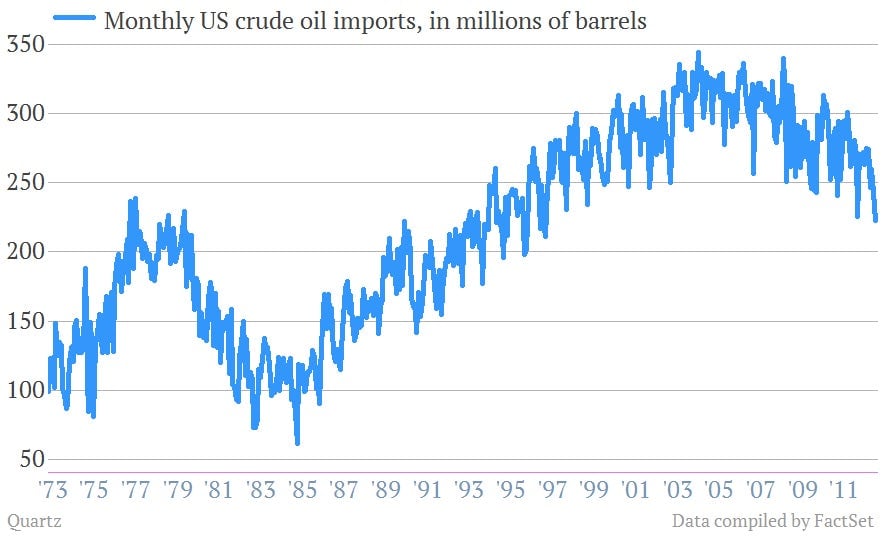
One chart that shows the tipping point of US oil imports
We’ve written plenty about the transformation of the global outlook for energy, which is being radically altered by a flood of new oil and gas production. But you can really see it happening. Like, right now. On Feb. 8 the US Commerce Department reported that record oil exports helped shrink the US trade deficit to its lowest level in three years.

We’ve written plenty about the transformation of the global outlook for energy, which is being radically altered by a flood of new oil and gas production. But you can really see it happening. Like, right now. On Feb. 8 the US Commerce Department reported that record oil exports helped shrink the US trade deficit to its lowest level in three years.
We thought it was worth spotlighting this chart, which suggests how the United States, long the world’s largest consumer of energy—until China nudged it aside in 2010—appears to be at a pretty interesting tipping point. Monthly barrels of crude oil imported into the US hit their lowest level since 1997 in December.
Americans still need a lot of oil. But they’re getting more of it from the US, where high prices have made drilling more profitable and more productive techniques—particularly in offshore exploration—are sucking more of the stuff out of the earth. Cars and trucks in the US also consume less gas than they used to, helping to drive consumption down. The upshot? Some anticipate that the US could become the world’s biggest oil producer sometime relatively soon. The International Energy Agency thinks it could happen by 2020. North America could start exporting more than it imports by 2030, the IEA says.
