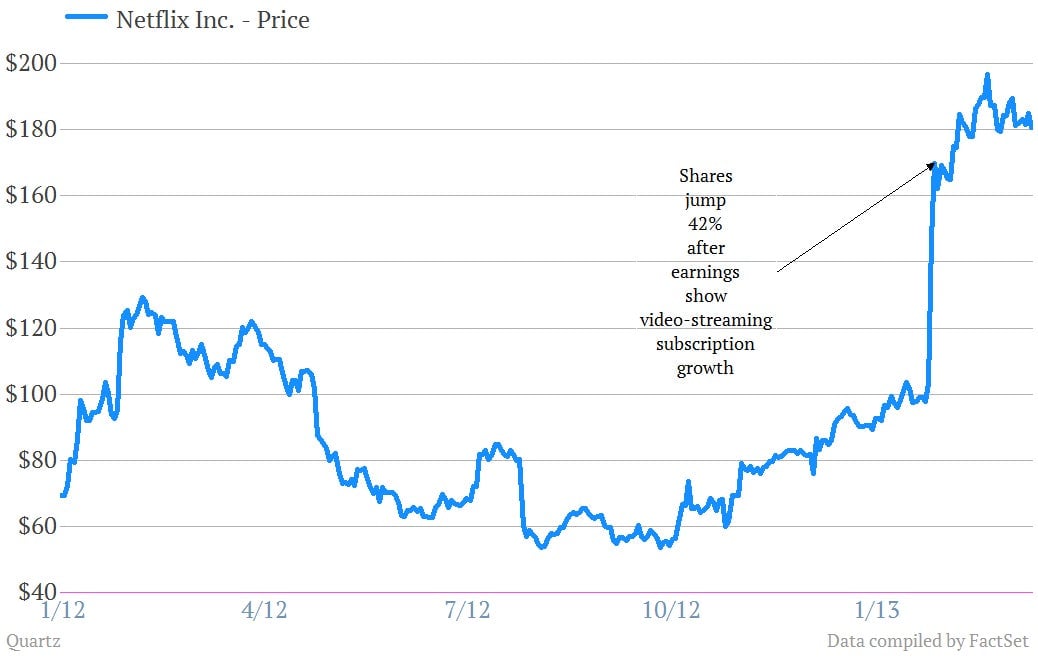
Meet the best-performing stock in the S&P 500 this year. Netflix is up a gobsmacking 97% in 2013 alone. Much of that came on Jan. 25, the day Netflix earnings turned a whole host of cynics into believers as it posted better-than-expected subscriber growth in its video-streaming business. Here’s a look at the shares going back to the start of 2012.
Meet the best-performing stock in the S&P 500 this year. Netflix $NFLX is up a gobsmacking 97% in 2013 alone. Much of that came on Jan. 25, the day Netflix earnings turned a whole host of cynics into believers as it posted better-than-expected subscriber growth in its video-streaming business. Here’s a look at the shares going back to the start of 2012.
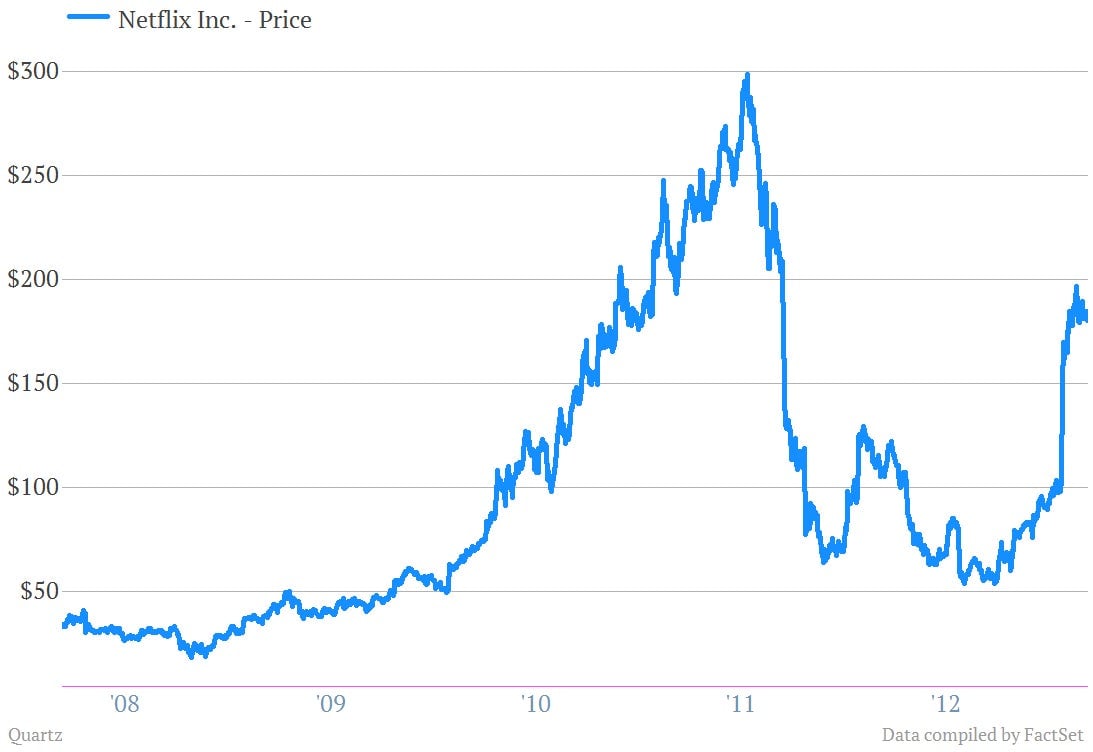
The saga of Netflix over the last decade has created one of the more bizarre-looking stock charts in recent memory. It effectively shows two booms in the share price, separated by only about a year. As a bit of a reminder, Netflix shares suffered an epic collapse between Jul. 13, 2011—when they etched a high-water closing price of $298.73—to Nov. 25, when the stock was at $63.86. The collapse of nearly 80% was seemingly set off by a somewhat
Join 500,000+ readers who start their day with Quartz.
By subscribing, you agree to our Terms of Service and Privacy Policy.