S&P 500 hits all-time record—despite Apple
Finally.


Finally.
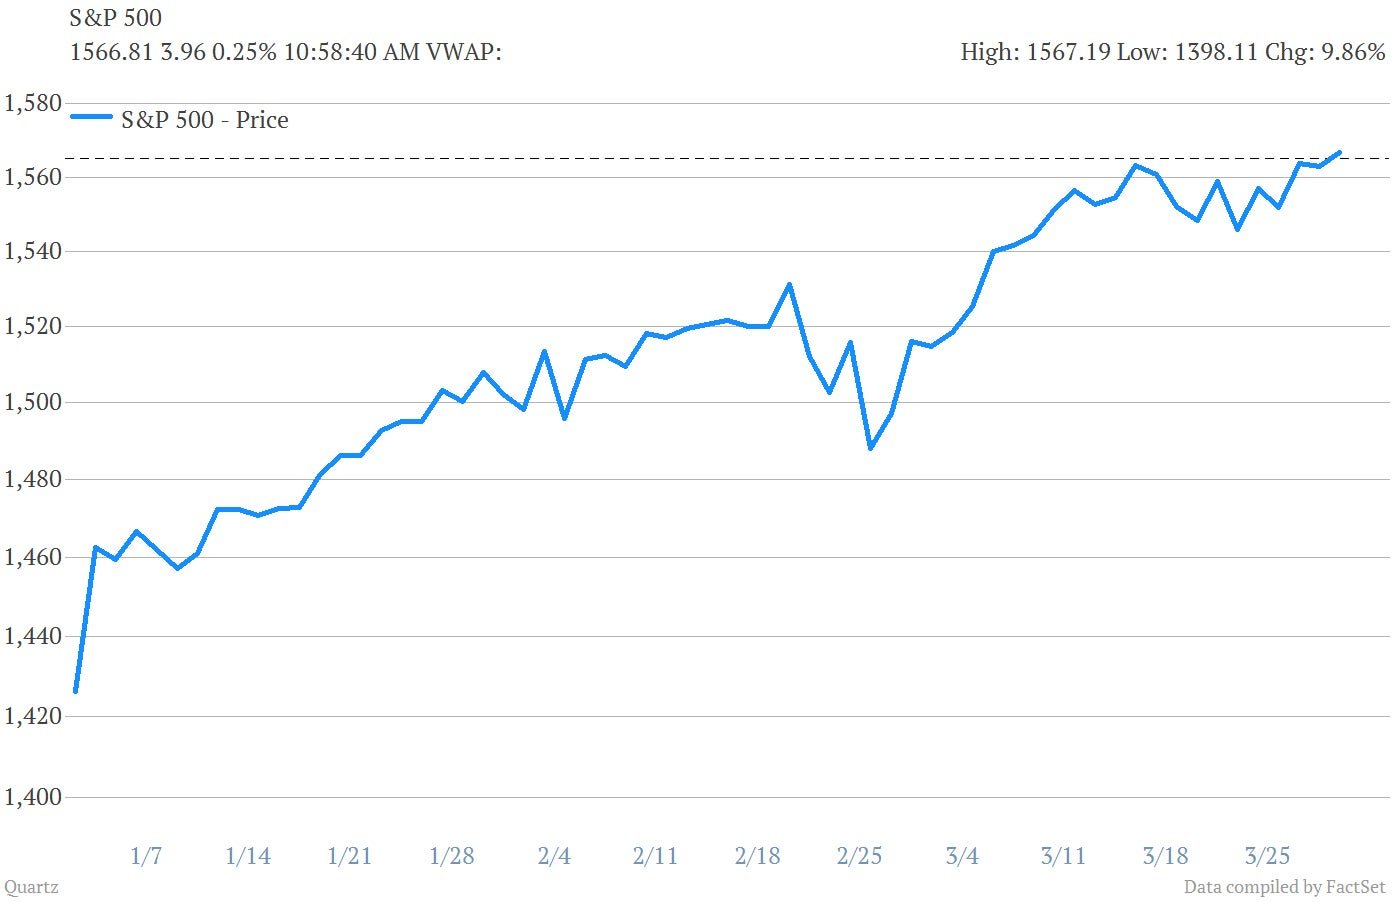
The S&P 500 has jumped its all-time nominal closing peak this morning, scrambling over the previous high-water close of 1565.15, set back on Oct. 9, 2007 (though of course, we don’t know whether it will close above the high, making it official). Yeah, yeah. We’re still short of the all-time intraday mark of 1576.09, set on Oct. 11, 2009. And yes, if you want to adjust for inflation, we’re nowhere near the all-time peak levels of the stock market at the height of the tech boom. (paywall.) But can we all just enjoy the view for a second.
Here’s a snap shot of the S&P’s ride this year, with us making the breach—dotted line is 1565.15 mark—this morning.

And here’s a longer look.

Of course, market addicts will remember that the Dow Jones Industrial Index managed to surmount its 2007 highs back on March 5. Why did it take longer for S&P to move beyond the previous peak?
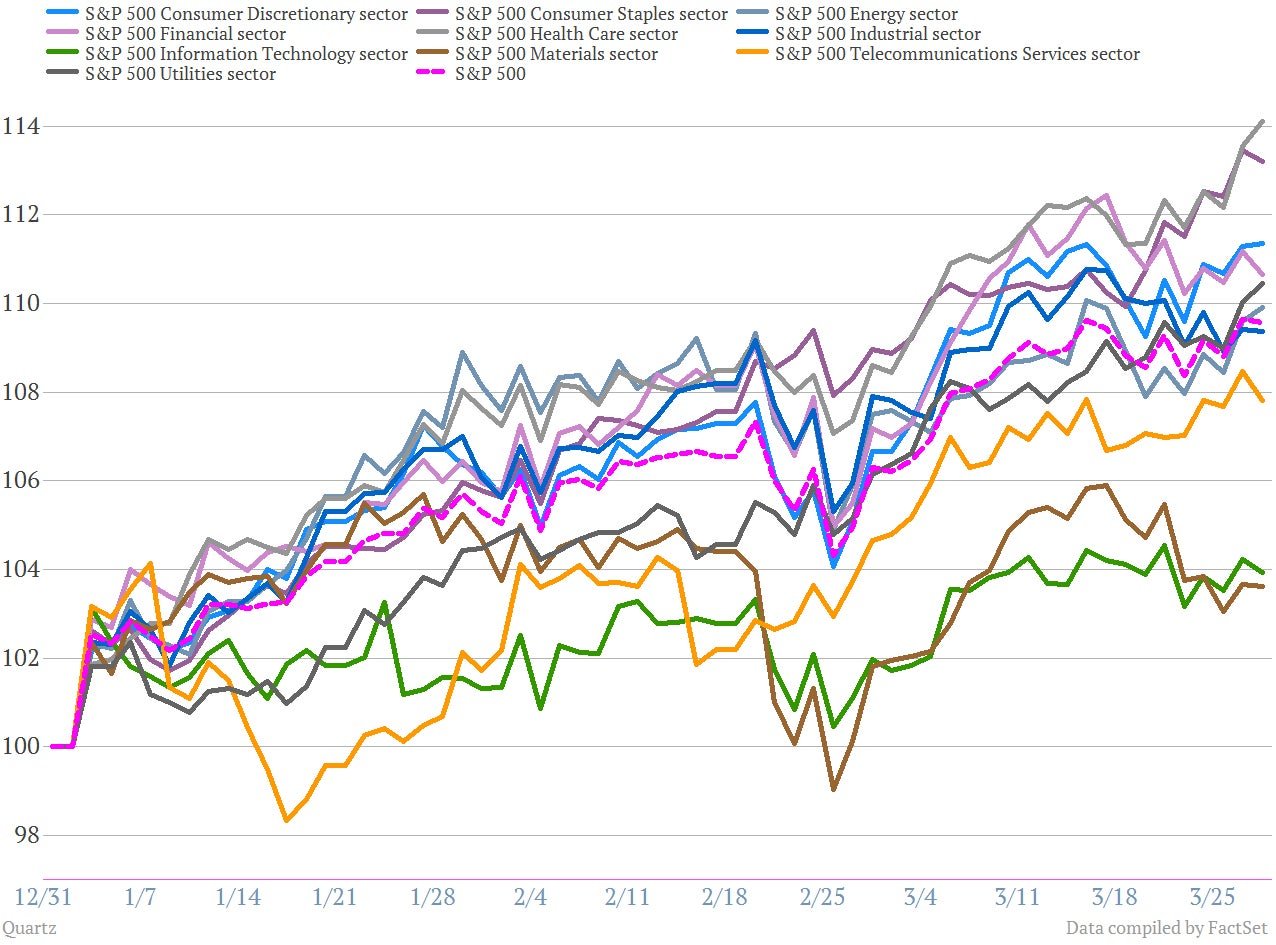
Well, to put it biblically, Apple giveth and Apple taketh away. The massive size of the company—the S&P 500 is weighted by market cap—amounts to 3% of the index as of Monday’s close, giving it biggest sway of any S&P stock. That was a fine thing for the S&P when Apple was the stock market’s darling. But as Apple has struggled—about 33% from its peak back in September—the shares of the tech behemoth have turned into an albatross around the neck of the the blue-chip stock-market metric, especially the tech sector. Here’s a look at the 10 “sectors” of the S&P, through Wednesday’s close. You can see how tech—the green line near the bottom—has lagged. That’s largely Apple’s fault.

Of course, it’s worth noting that even with the recent sluggishness in Apple shares, the company is still, overall, positive for the S&P 500 index. The S&P closed Wednesday within 0.2% of it’s 2007 peak; excluding Apple from the index—which is still up roughly 170% since the market peaked in 2007—the S&P 500 would have been roughly 2% below the peak, according to Howard Silverblatt, S&P’s chief index analyst.