Here’s today’s US economic chartbook
A bunch of odds and ends out this morning on the US economy. Here’s a look:

A bunch of odds and ends out this morning on the US economy. Here’s a look:
Factory output stays strong
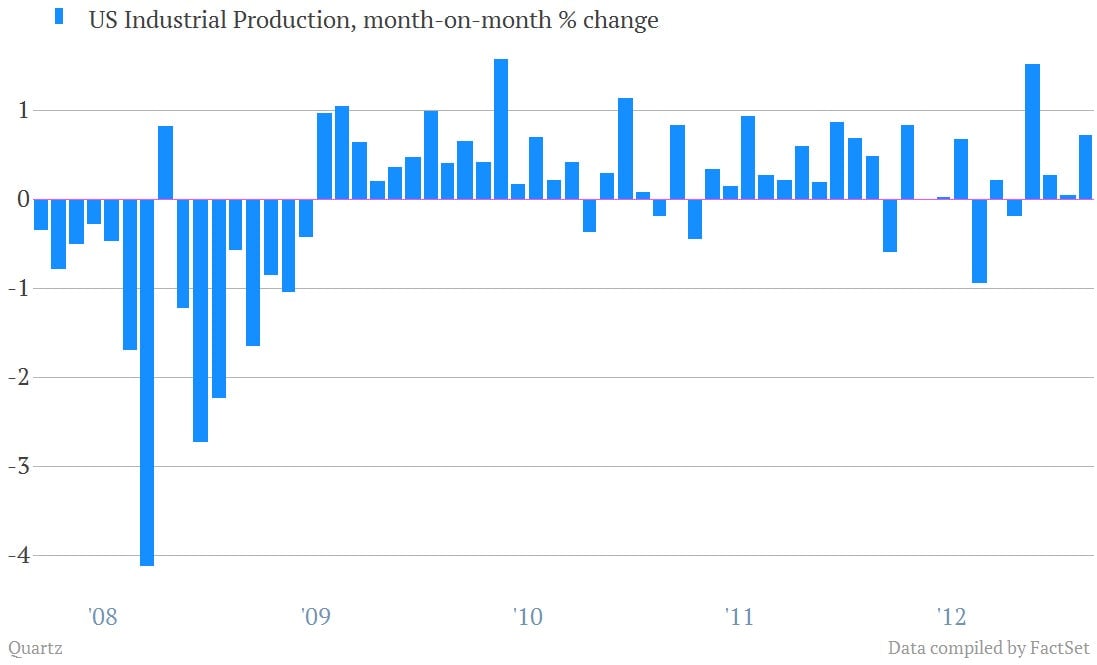
- Production at mines, utilities and plants beat Wall Street expectations, rising 0.7% over the prior month. “Capital goods are doing well, autos came back a little bit and there’s strength in consumer goods. It’s looked pretty broad-based,” JP Morgan economist Michael Feroli told Bloomberg.
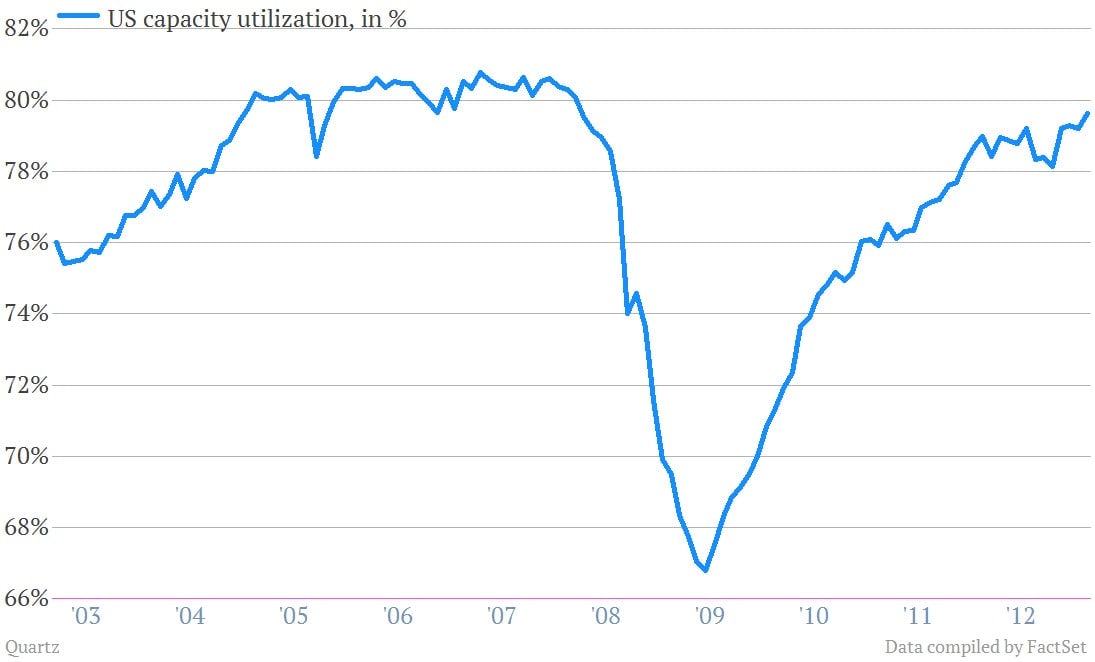
- And there are signs that the US industrial engine is beginning to operate more efficiently, after having suffered significant damage during the financial crisis. Capacity utilization hit its highest level since March 2008.
Ignore headline inflation
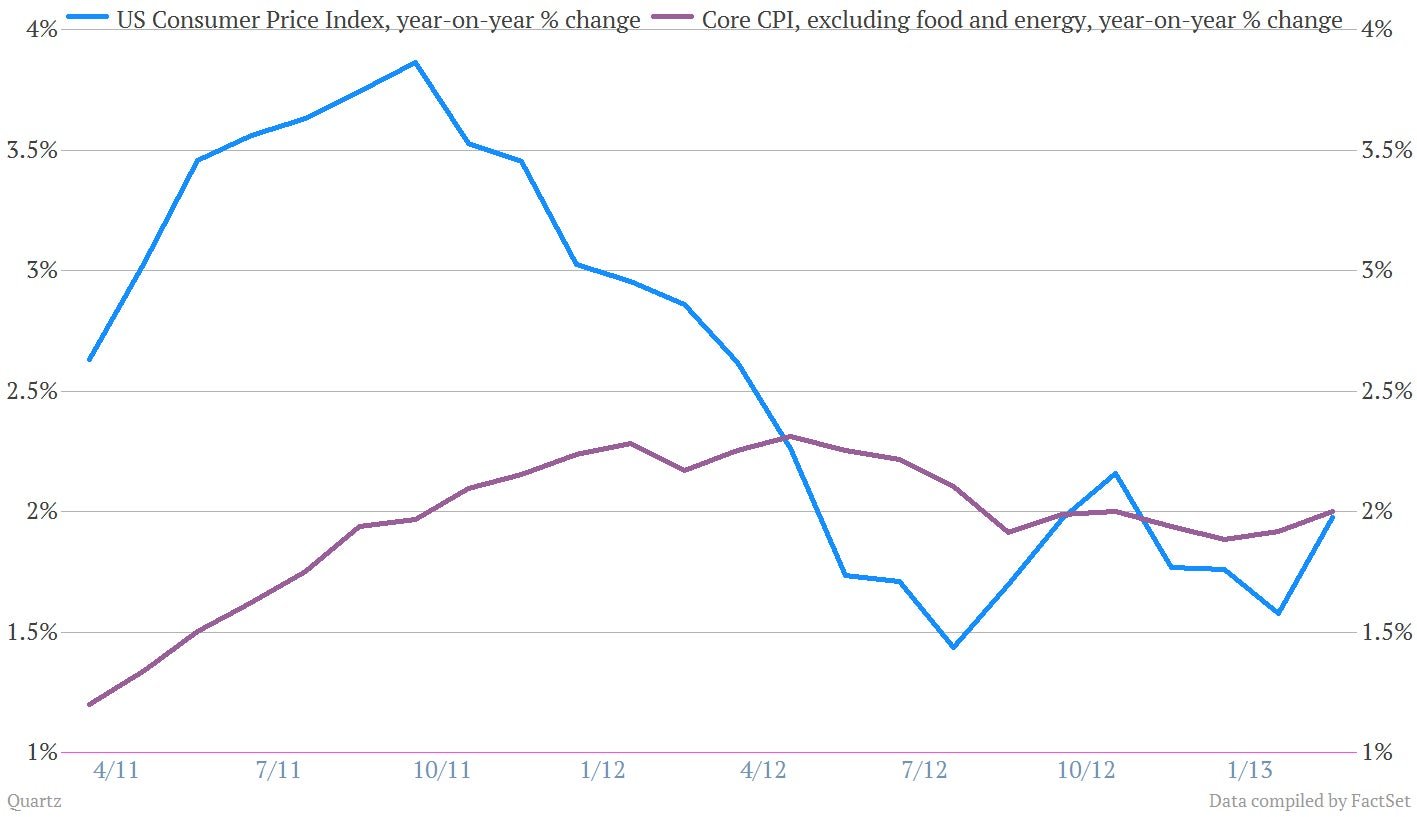
- It was up a bit due to high gas prices in February. But prices at the pump are already receding. The “core” reading was just as expected, at 0.2% in February.
Early glimpse at March data looks strong
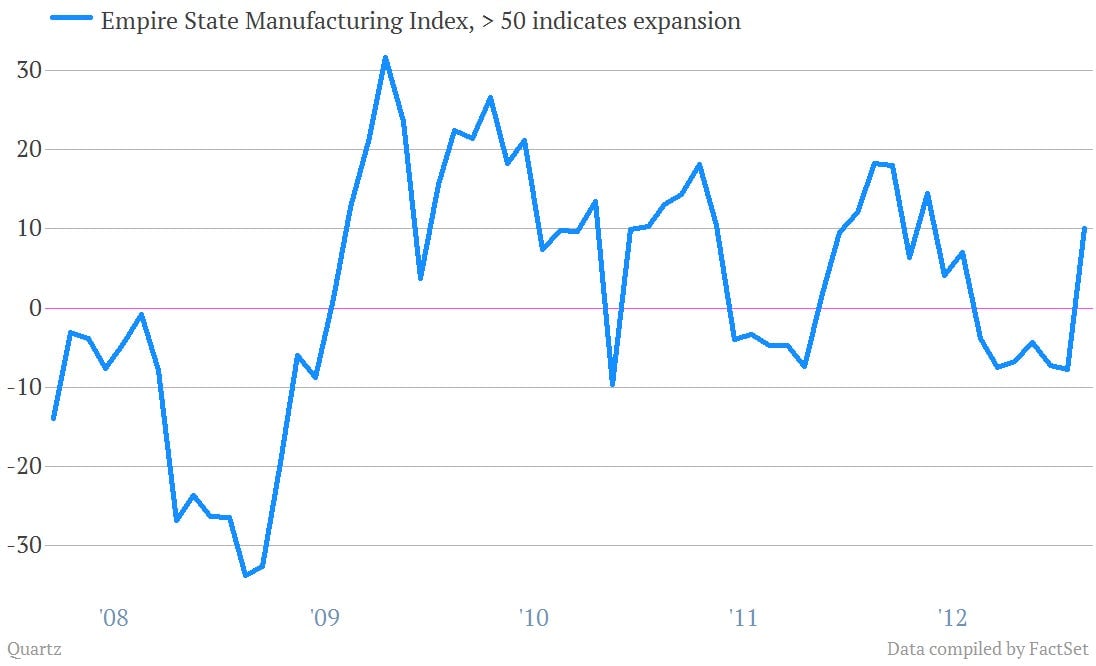
- Admittedly the Empire State Manufacturing Survey is of limited scope. (It looks only at New York state’s factories.) But it’s one of the earliest substantive reads on March in the economic data calendar. A number above 50 indicates expansion, and the March reading showed a jump back into growth territory.
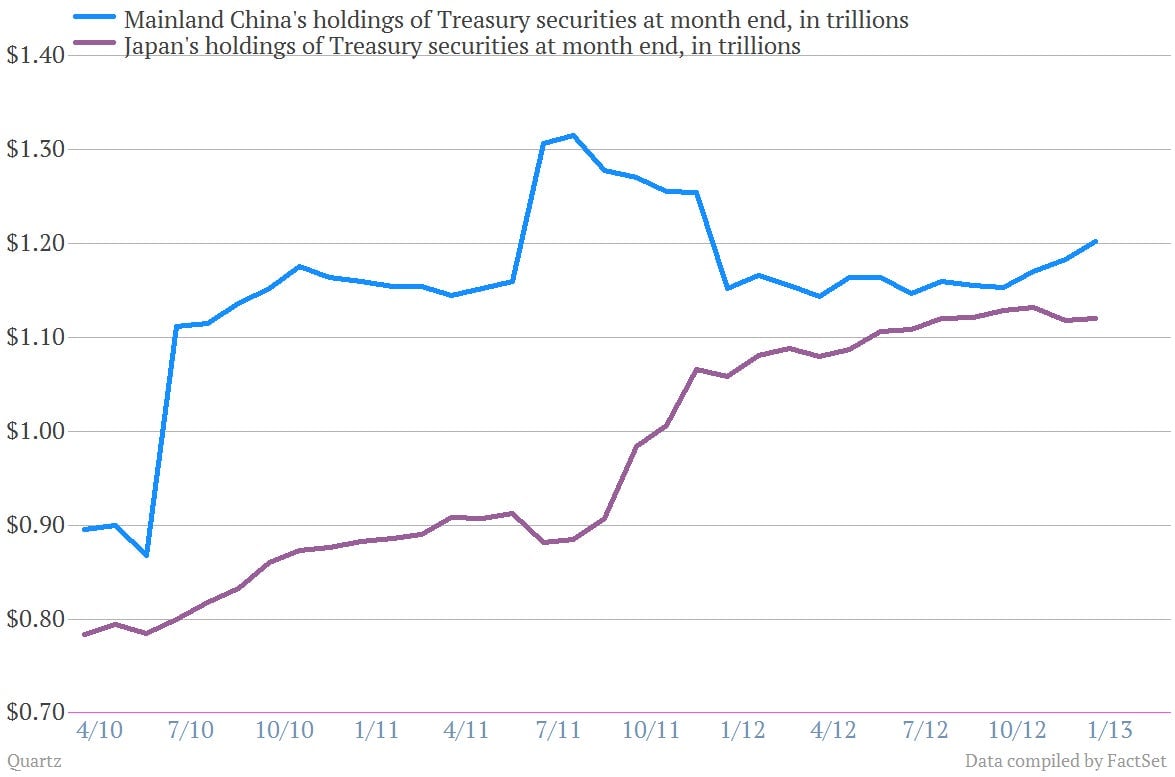
Foreigners boosted buying of US Treasurys in January
Among the big buyers, China boosted holdings in December and Japan’s inched up. Overall foreign buying of Uncle Sam’s debt amounted to $32.3 billion, up from $29.9 billion in December.
