Tweaking GDP statistics won’t hide the fact that Americans are doing worse
Uncle Sam is about to rewrite US economic history stretching all the way back to 1929.


Uncle Sam is about to rewrite US economic history stretching all the way back to 1929.
With a statistical flick of the switch starting in July, the US government will increase the size of the world’s largest economy by about 3%. How? The agency that tallies up US GDP is going to be changing the way it counts spending on research and development. Here’s the short version, from the Financial Times, which published a solid story on the change (paywall).
At present, R&D counts as a cost of doing business, so the final output of Apple iPads is included in GDP but the research done to create them is not. R&D will now count as an investment, adding a bit more than 2 per cent to the measured size of the economy.
Over at the Washington Post, Neil Irwin explains it this way:
Now BEA [the Bureau of Economic Analysis] will treat research and development and creation of artistic works as longer-term investments, not unlike factories, equipment, or software. On a purely technical level, this should more precisely match GDP in any one quarter to the actual economic value the nation generates in that span. In the old system, the value of the economic output of a Star Wars movie would only show up in GDP over decades to come, in the form of personal consumption expenditures like movie tickets and DVD sales.
So should you care?
Unless you’re one of the people on Wall Street or in academia whose professional reputation rests on how closely they can guess where GDP growth will be each quarter, probably not. In fact, if you’re interested in figuring out anything meaningful about the economy, like, say, how the people in it are actually doing, GDP is a pretty awful measure.
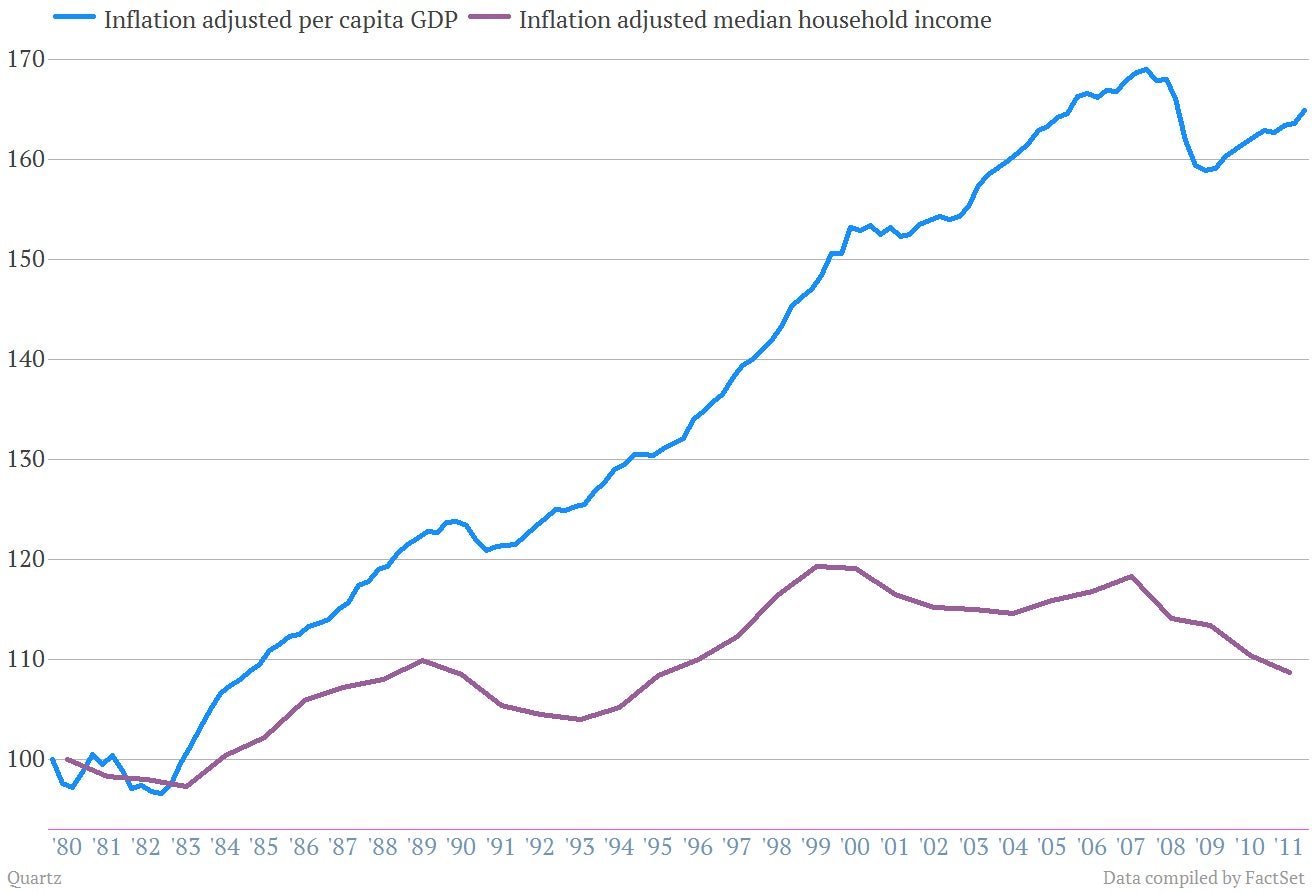
For instance, one traditional measure of how Americans are doing is to look at per capita GDP, which is basically the total output of the economy—GDP—divided by the population. Essentially, this measures average income. And since the end of the Great Recession in the second quarter of 2009, that measure is up by roughly 5%. Granted, that’s after a steep fall. But not too shabby.
But another important number is median household income, which essentially measures the income of a typical US family. In 2011, the last data available, that inflation-adjusted number fell 1.5% to $53,054, a level last seen in the mid-1990s. Between the final quarter of 2007, when median household income peaked, and the end of 2011, when we last have data, this measure of American well-being came down by more than 8%. Over the same period, per capita GDP was down less than 2.5%. Over a longer time frame, the divergent pictures these two measures draw of the health of a typical American family are even more stark. Here’s a look at GDP per capita versus median household income, going back to 1980. (Both are indexed to 100.) You can see they tell starkly different stories.

So what’s the point? The point is GDP doesn’t tell you a whole heck of a lot about how typical Americans are doing. And so the fact that the size of the total US economy is about to change because of a statistical tweak shouldn’t make much of a difference to the vast majority of Americans. They have a far more important and telling economic metric that they use to gauge the economy: Their paychecks.