Why the Dow 20K milestone is meaningless: a visual guide
If you’re reading this, you’ve probably heard that the Dow Jones Industrial Average hit 20,000 yesterday for the first time in its 132-year history. You may have also heard that it really doesn’t matter.


If you’re reading this, you’ve probably heard that the Dow Jones Industrial Average hit 20,000 yesterday for the first time in its 132-year history. You may have also heard that it really doesn’t matter.
Here’s why:
- Although there are thousands of publicly traded companies in the United States, the Dow is made up of just 30.
- There’s no clear methodology on how those 30 companies were chosen. The one thing many of them have in common is just that they’re very old.
- Because of how it’s calculated, the Dow is a bad indicator of how the economy is doing.
That may sound a bit complicated, but the math is actually dead simple.
The Dow takes the share price of each of its 30 companies, adds them up, and divides them by a weird number it made up. That number, called the Dow Divisor, is meant to make the Dow average a little less useless than just dividing the whole thing by 30. Which is to say that if one of the 30 companies makes a big structural change, the divisor can be adjusted to keep the overall number from going completely off the rails. Currently, the divisor is 0.14602128057775.
So why is a Dow milestone so meaningless? To explain that, we’ve borrowed a simple explanation from a classic Planet Money episode, and put it into charts.
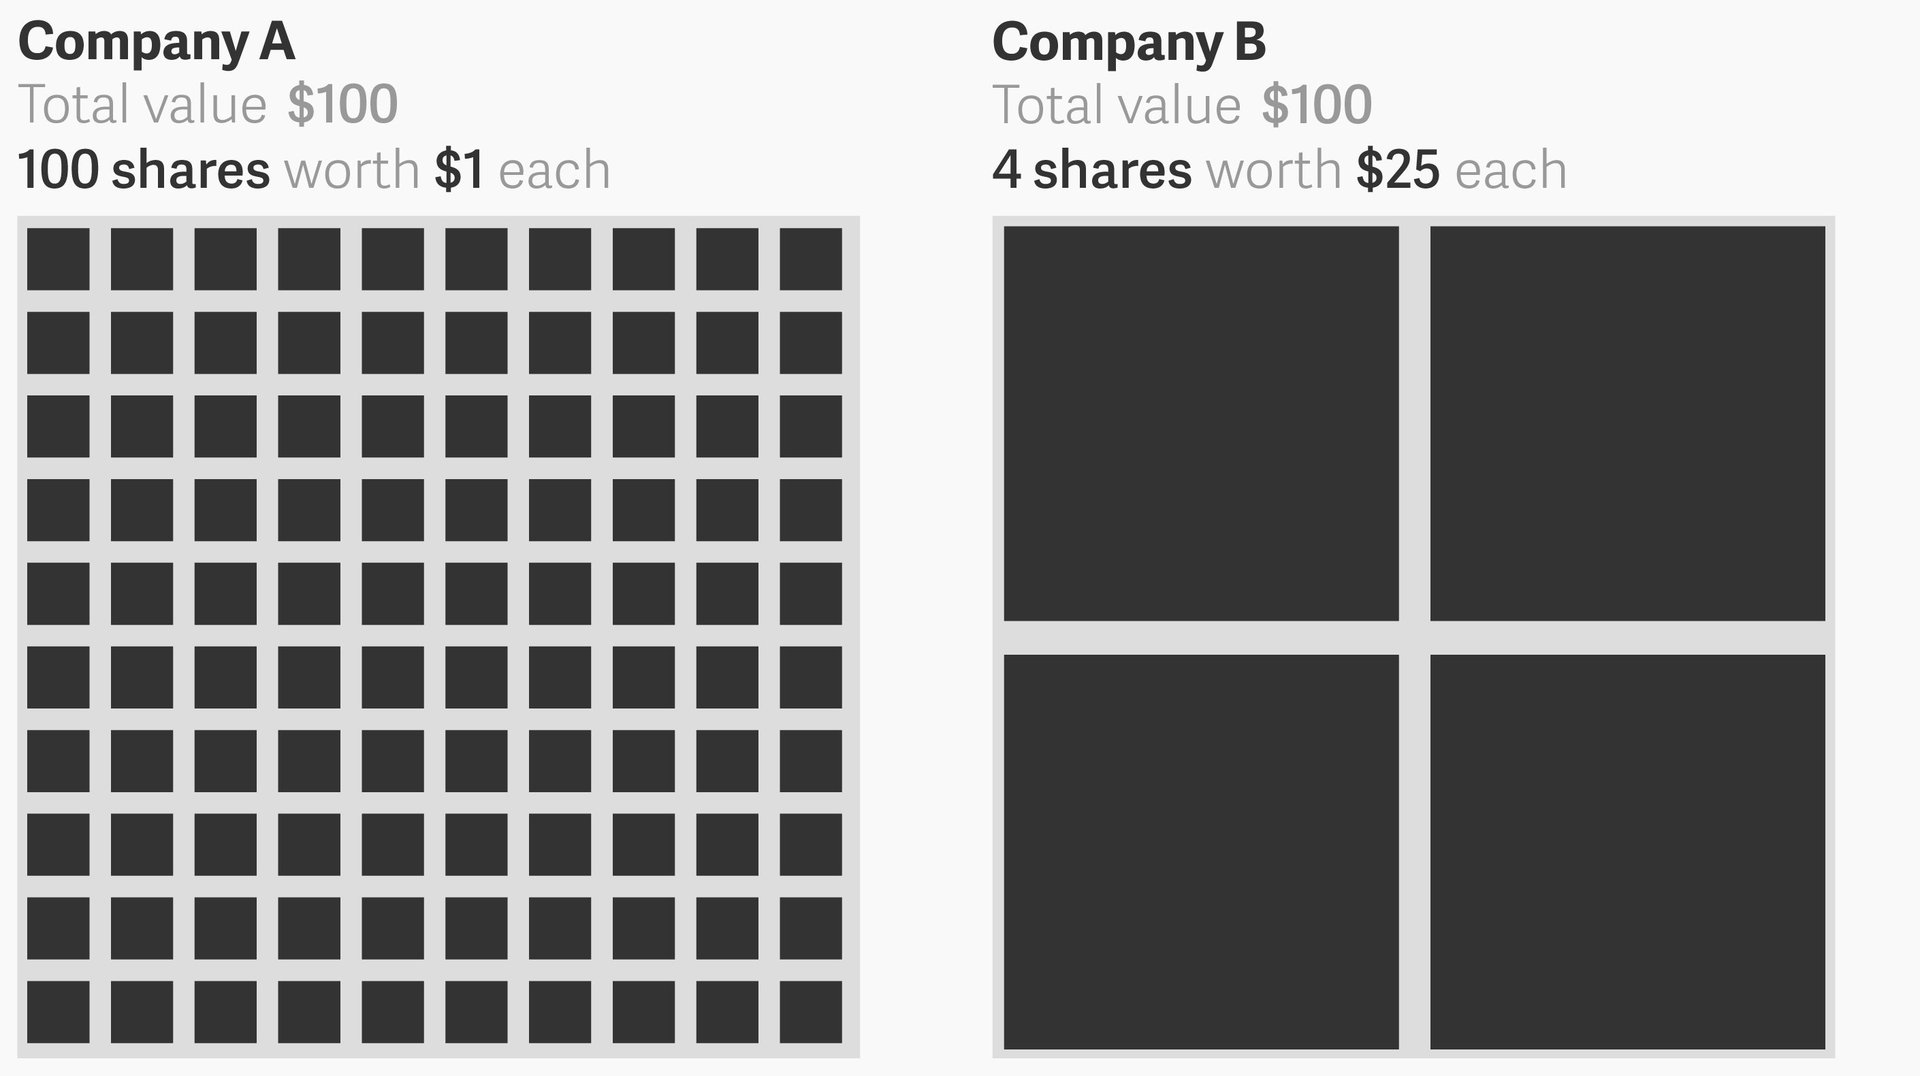
Let’s pretend the Dow includes two companies; we’ll call them Company A and Company B. Both companies are worth the same amount of money: $100. The difference between them is that Company A has split itself into 100 shares worth $1 each, and Company B is made up of four shares worth $25 each:

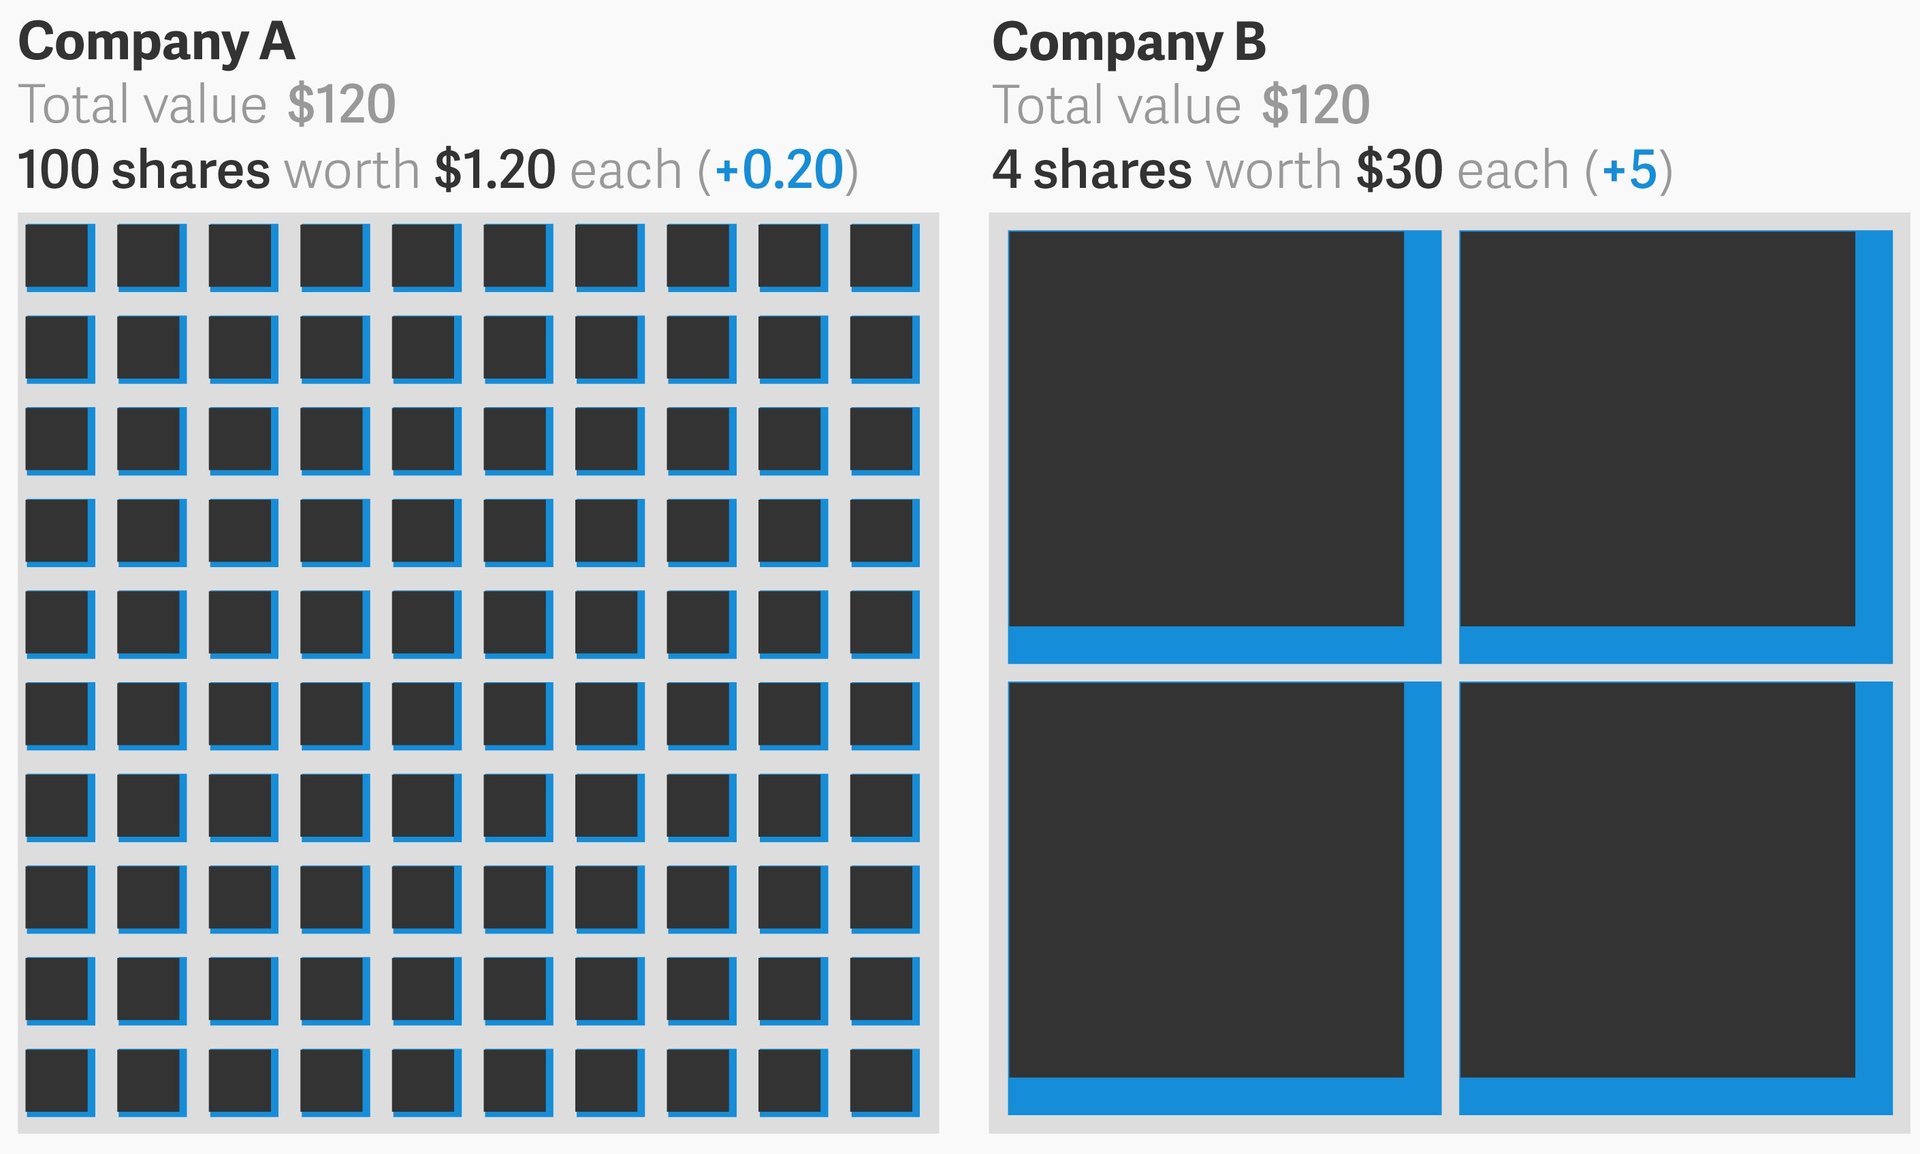
So Company A’s individual shares are worth less than Company B’s, but the two companies are worth about the same amount of money—$100—when you add up all of their shares. Now let’s say that on a given day, the share price of both companies increases by 20%, raising the total value of each to $120:

By now you may see where this is going. Even though both companies gained exactly $20, the increase in the value of Company A will affect the overall Dow Average far less than the increase in Company B:
Company A’s 100 shares gained 20 cents each, which would add only 1.37 points to the Dow total.
Company B’s 4 shares gained $5 each, which would add 34.24 points to the Dow total.
This is because the Dow only takes individual share values into account, rather than each company’s total value (or market capitalization). In a more reliable index like the S&P 500 or the Wilshire 5000, the two changes would have had an equal effect on the total, which is a more accurate representation of what happened.
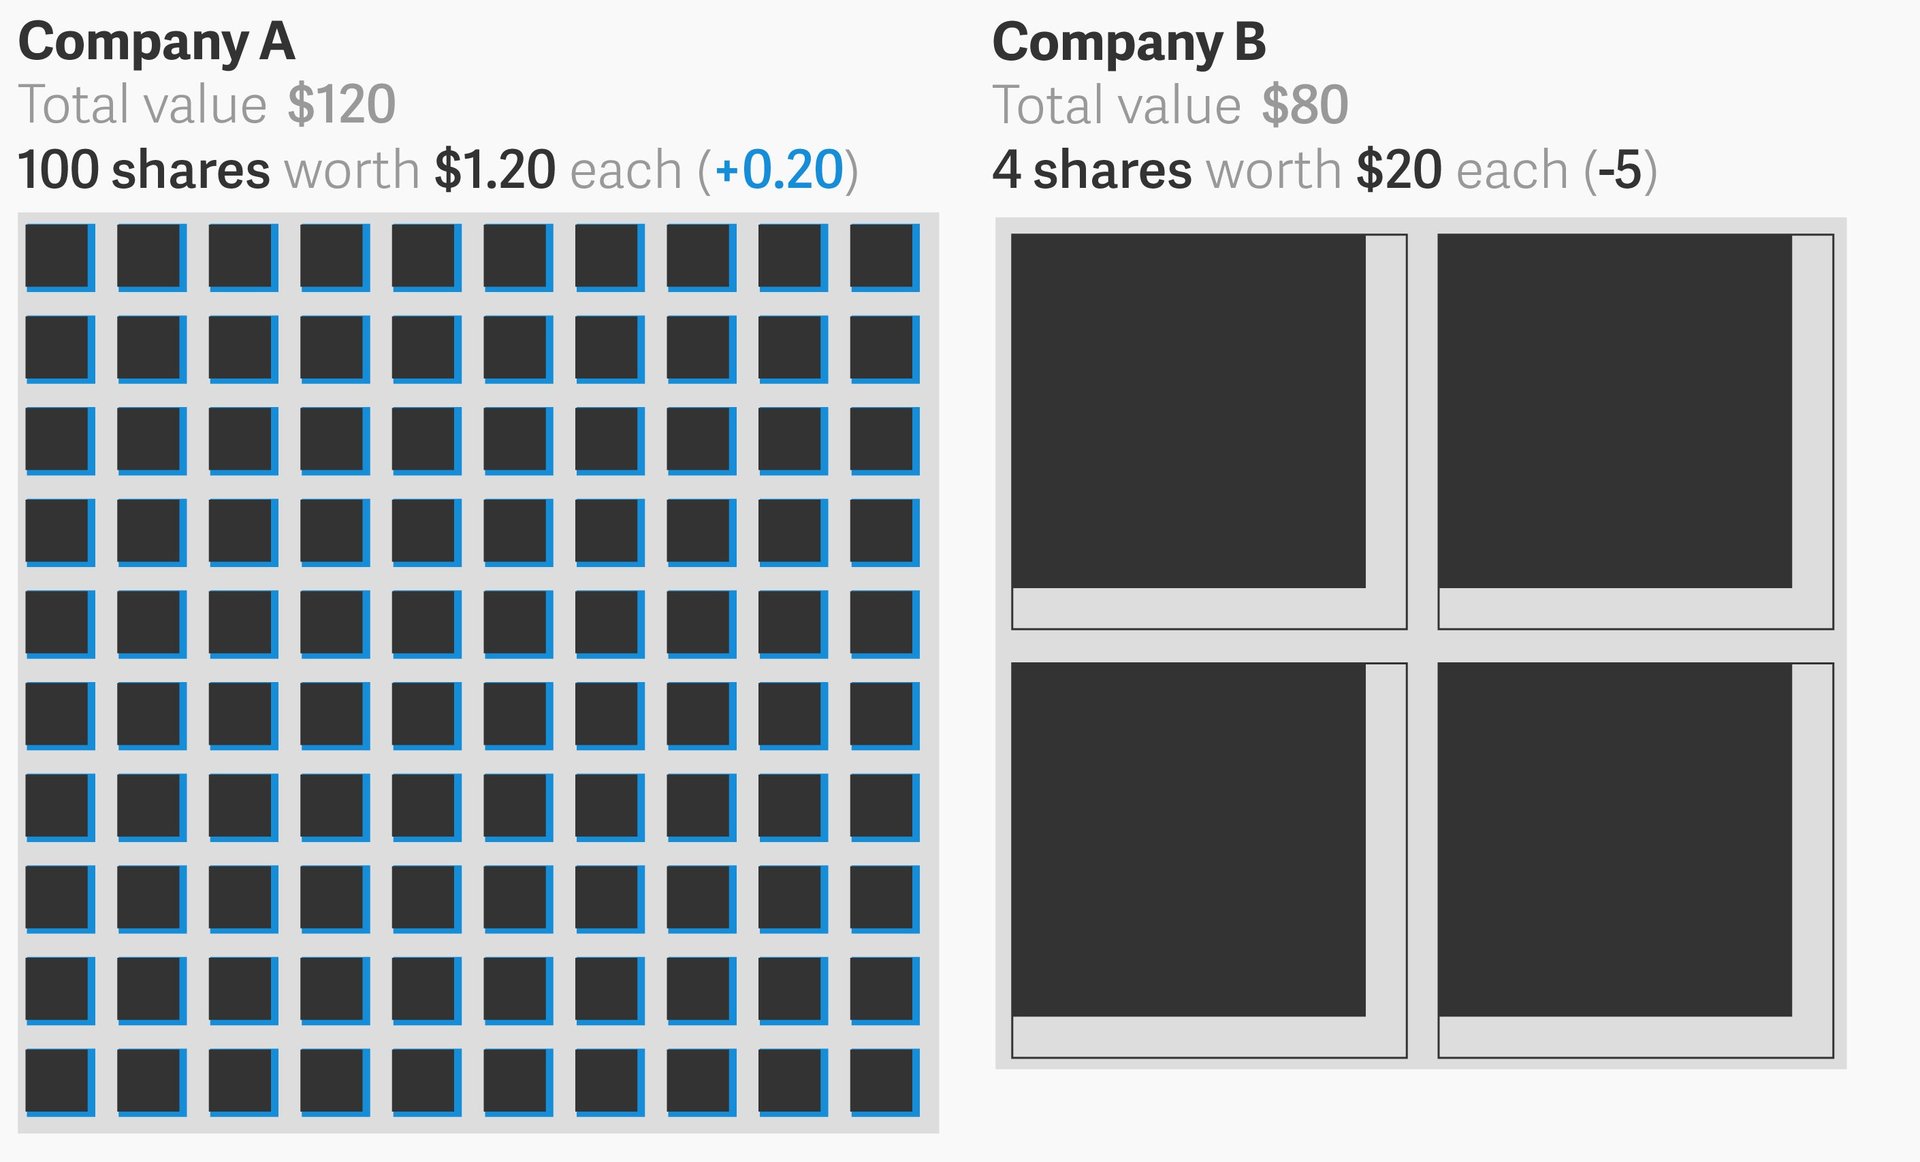
Let’s consider another scenario, again with both companies starting at a value of $100. What if Company A gained 20% (bringing its share price to $1.20) but Company B lost 20% (bringing its share price down to $20)?

In a more reliable index, the effect would be neutral. But the Dow would register it as a loss of $4.80. That would make the Dow drop by 32.87 points!
We’re not saying you can’t celebrate the 20K milestone—have at it!—but when it comes to the state of the US economy, trust us: You can ignore the Dow from now on.
Correction: An earlier version of the second series of graphics originally showed the 20% share-price increases in the squares by total area rather than square root. An earlier version also said the Dow is 121 years old. It’s been called the Dow Jones Industrial Average for 121 years, but existed as the Dow Jones Average for 132.