Gold’s ugly selloff explained, in three charts
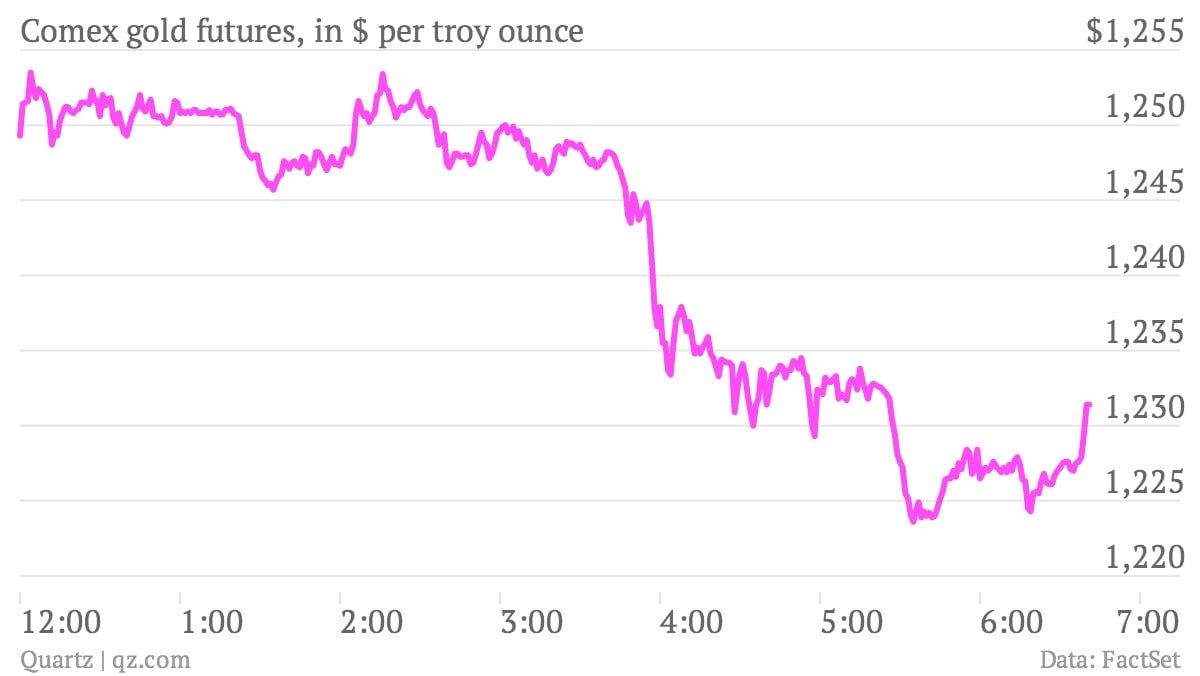
It looks like the inflation hysterics are receding. Yesterday’s solid US economic data made it seem more likely that the Federal Reserve will unwind some of its bond-buying programs. Gold is down more than 3% today. Here’s a look at the overnight price.

It looks like the inflation hysterics are receding. Yesterday’s solid US economic data made it seem more likely that the Federal Reserve will unwind some of its bond-buying programs. Gold is down more than 3% today. Here’s a look at the overnight price.

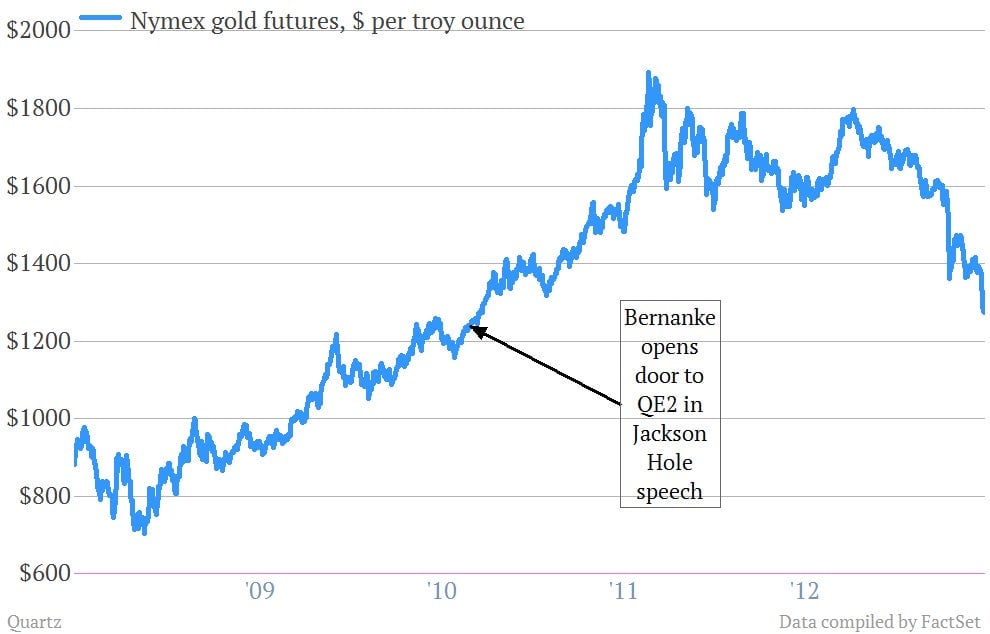
In fact, gold prices are back to levels not seen since August 2010. That was the month in which, with the US economy showing signs of losing speed, US Fed chair Ben Bernanke famously hinted that the central bank might do a second round of bond-buying (dubbed QE2).

In those programs, the central bank creates new money and uses it to buy things like government bonds as a way of pushing more cash into the economy. In the view of goldbugs, bond-buying would undoubtedly spark Weimar-style hyperinflation.
But the goldbugs have been wrong. The Fed’s favorite gauge of inflation—the core deflator included in the personal consumption expenditures report—is near the lowest on record.

If anything can be described as hyper, it’s the goldbugs who are no doubt hyperventilating now.