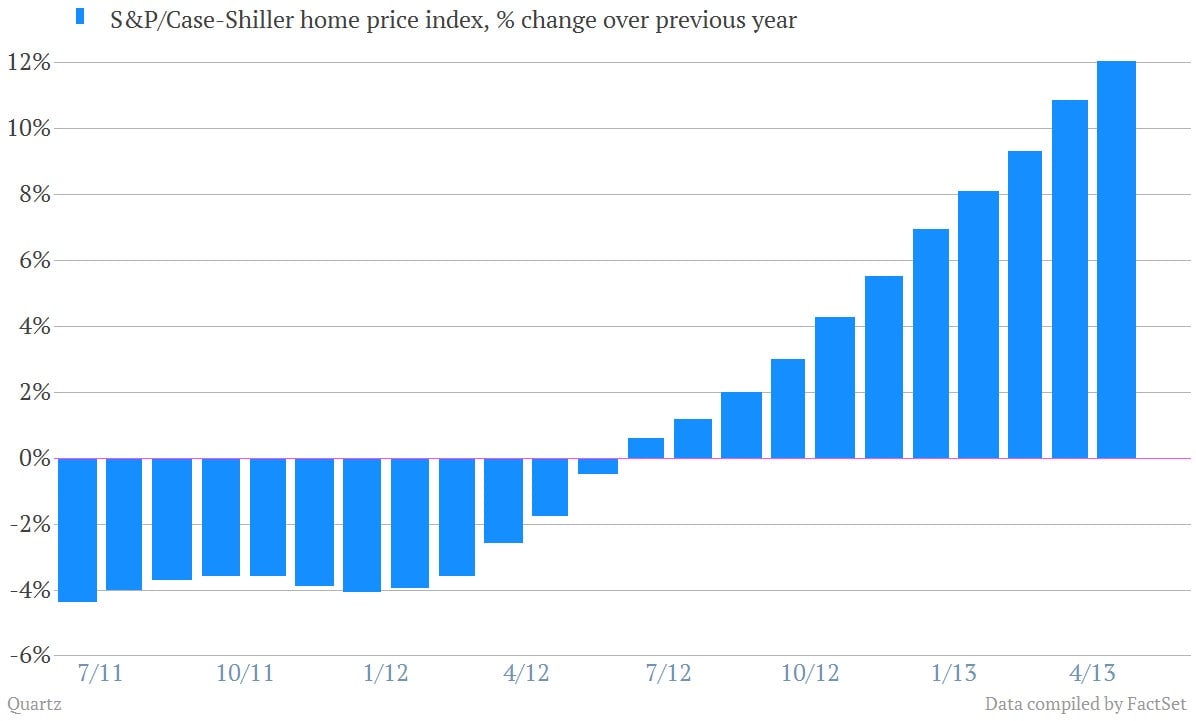
We’ve told you ad nauseam that US housing was recovering. One of the latest updates this week showed the 20-city Case-Shiller housing price index surging 12.1% from the prior year in June. Hoo-aaaah!
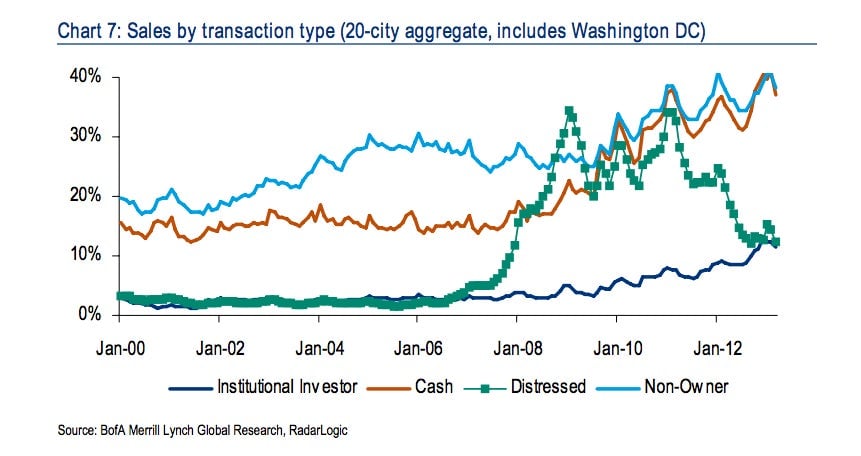
We’ve also told you that a big part of the push higher in prices has been driven by purchases by investors. That includes Wall Street. (Earlier this month the New York Times had a good piece laying out some of the biggest players in Wall Street’s latest property play.) Bank of America $BAC Merrill Lynch analysts churned out this terrific chart that lays out how active investors have been. (“Investors” largely includes cash buyers, as well as institutional investors, who have also picked up their activity.)
Of course, as prices for homes have risen, the potential returns on buying swaths of homes and renting them out have shrunk. Carrington Holding, which has been an active buyer, recently said that higher home prices have started to make the trade unattractive. It’s starting to sell homes, rather than buy.
That will be something to keep an eye on. Especially in cities like Las Vegas, Phoenix and Miami where the home busts were especially deep and investor purchases have been heavily concentrated. If investors start to move towards the exits there, the peppy home price rises we’ve seen may not hold up.