The fear index: Scared stockless
The market's volatility metric.

We’re talking fear
Suggested Reading
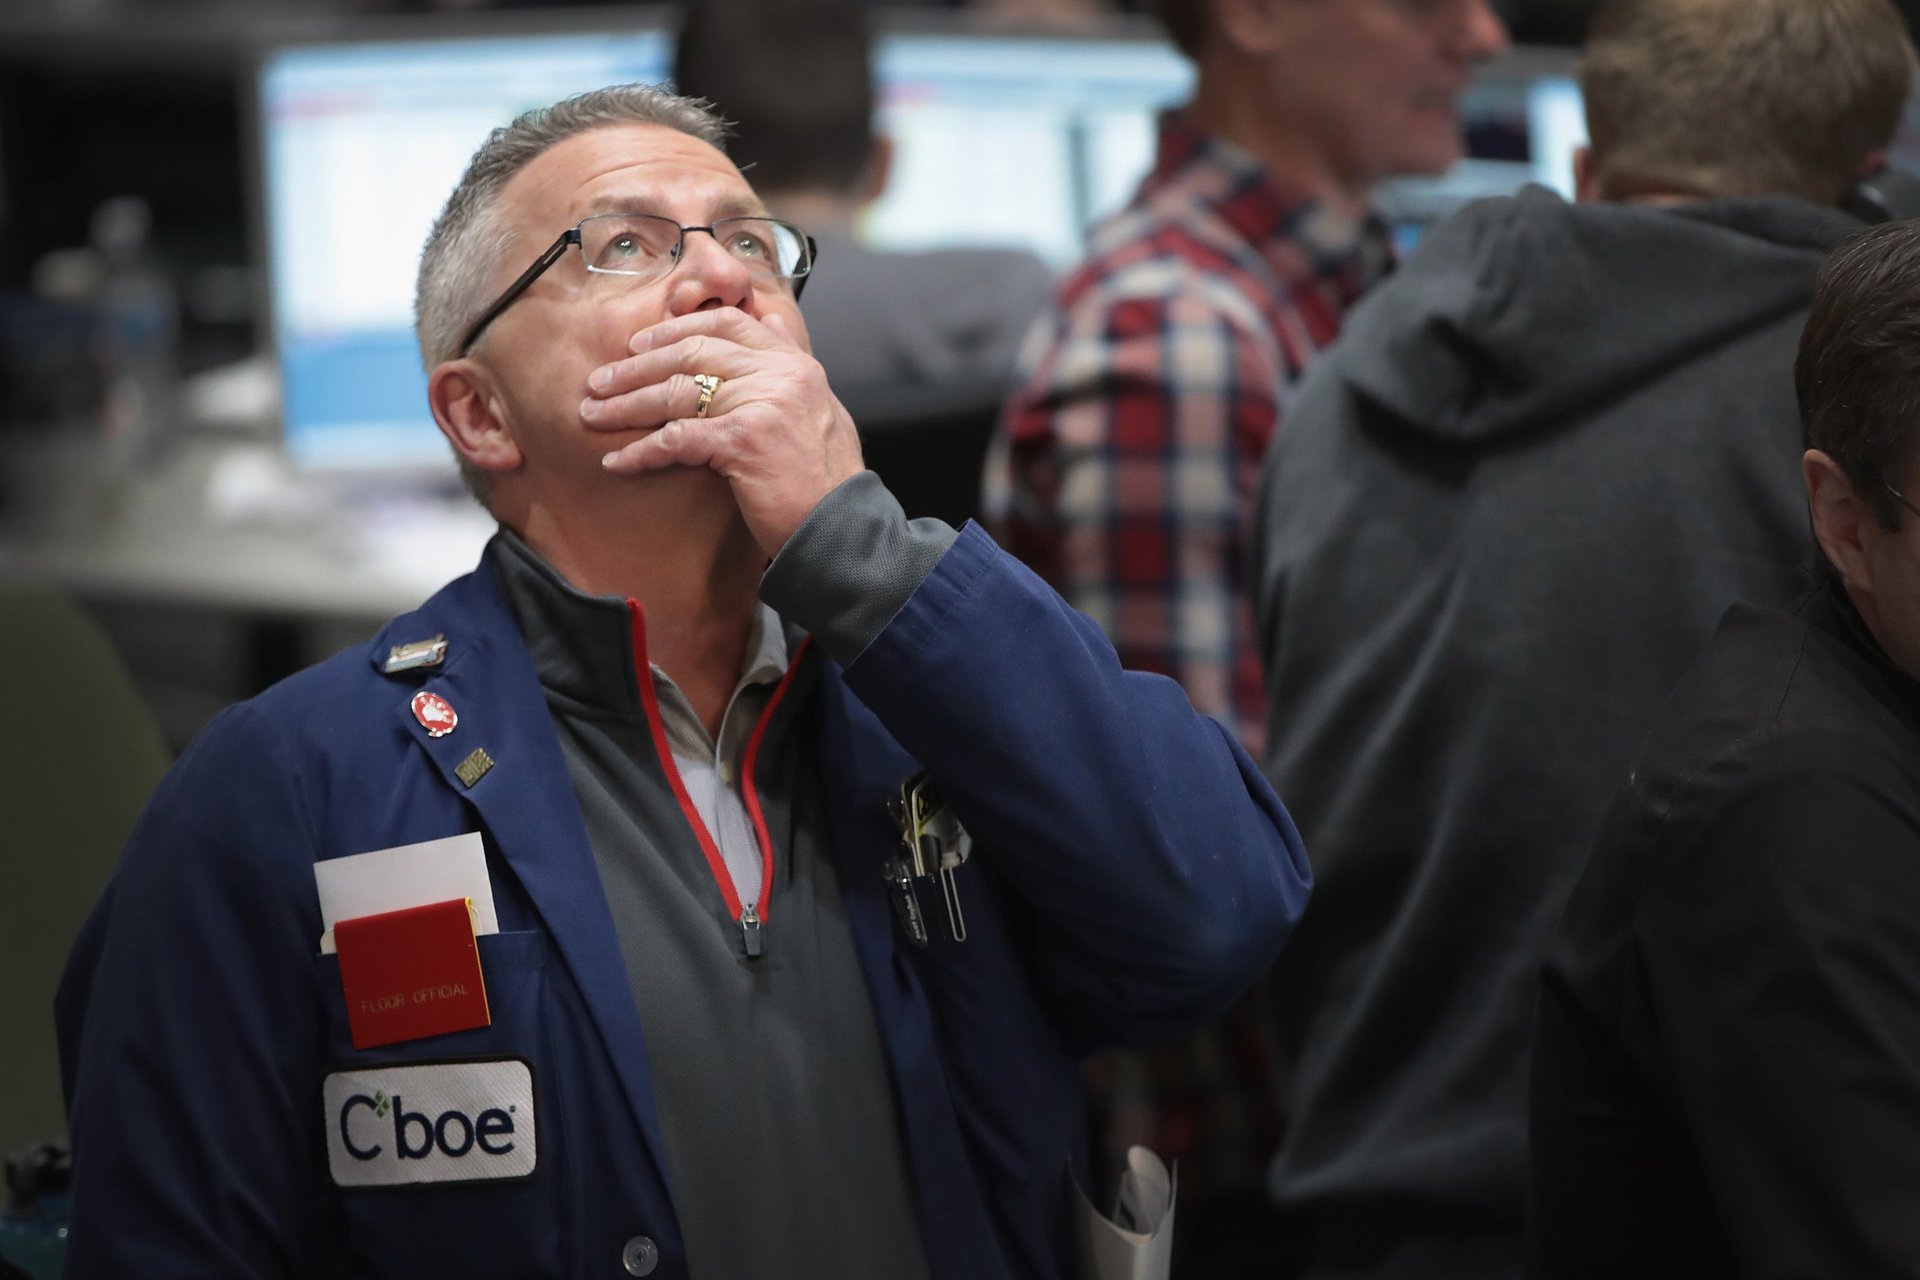
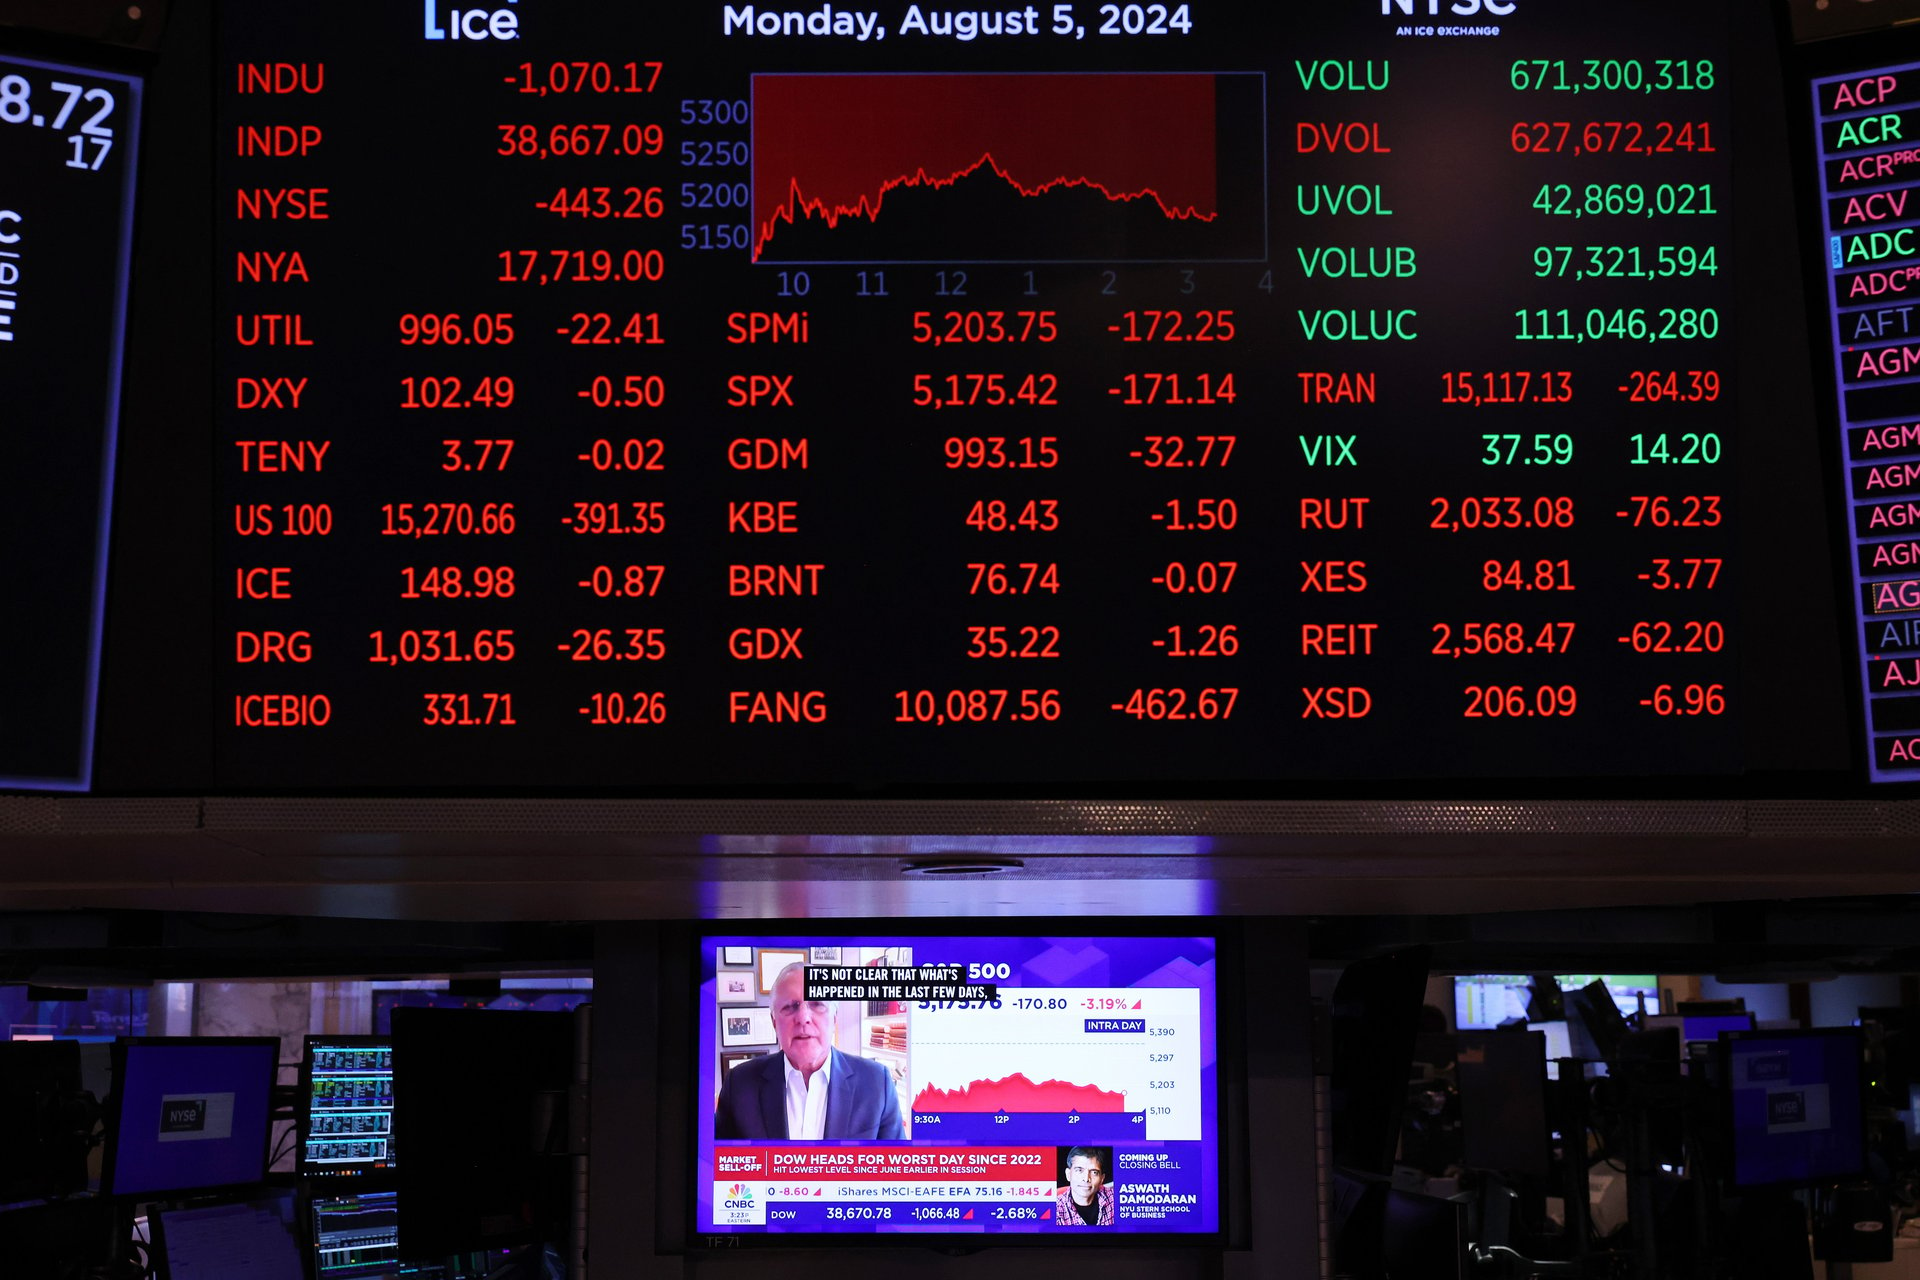
Monday was the kind of day investors dread. Many woke up to a Nikkei performance that was as bad as it’s been since Black Monday in 1987. The global market dominos quickly began to topple throughout the day: The S&P 500 lost $1.3 trillion in market value, the Dow more than 1,000 points, and the Nasdaq shed nearly 600 points. Tech issues at online trading platforms even locked out users at the height of the selloff.
Related Content
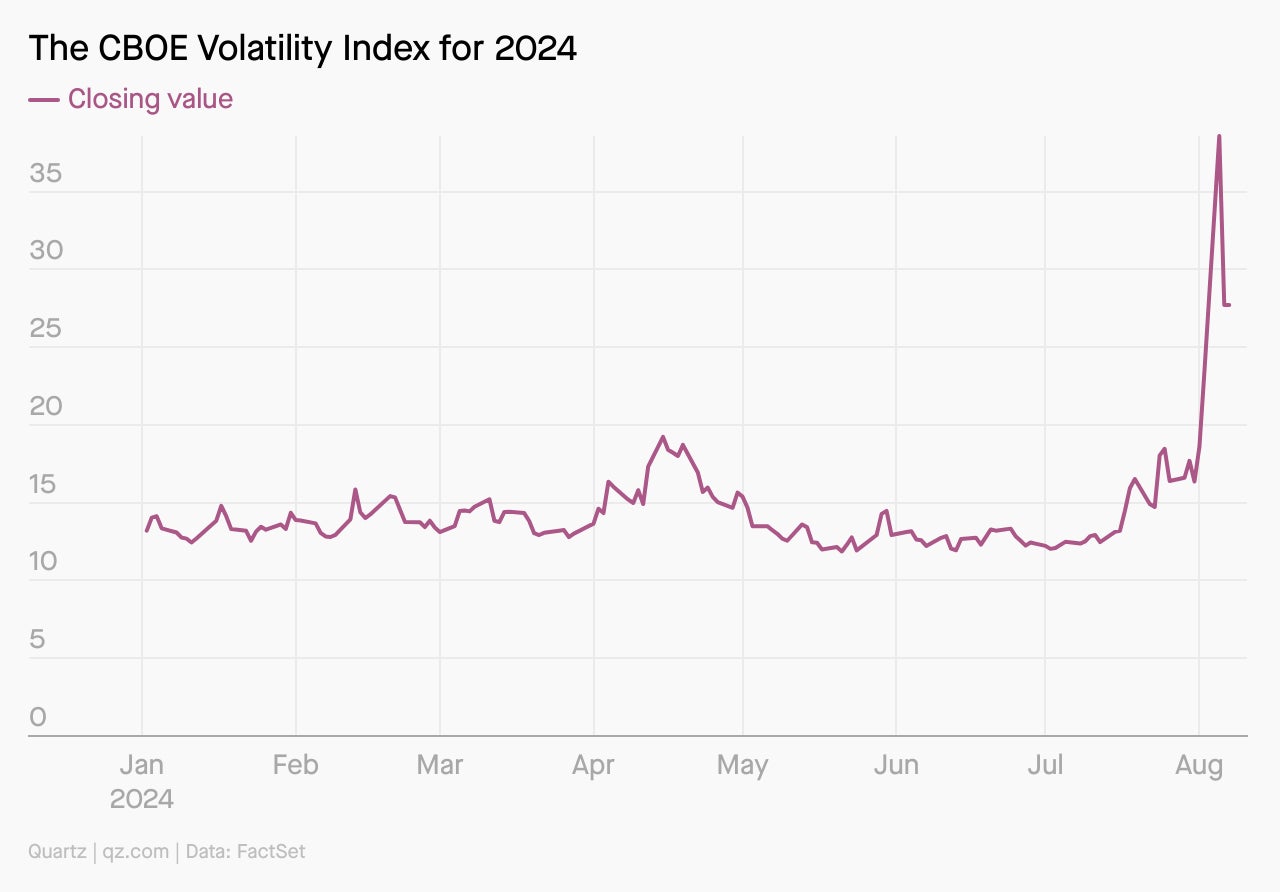
Investors were downright scared, in the anecdotal sense, as well as statistically. The stock market’s fear index — the CBOE Volatility Index, also simply known by its ticker, VIX — rose to levels that haven’t been recorded since March 2020 (you know, when COVID-19 was exponentially spreading across the globe).
The VIX has since recalibrated with the recovering stock market, but that doesn’t mean investors are zen. The stock market will likely remain unsettled, possibly for several weeks. As Nicholas Colas, co-founder of research shop DataTrek, told Market Watch on Tuesday: “We’ve gone from markets believing the future was highly predictable to very unpredictable, and with remarkable speed. The journey back to calmer waters will not be as fast. It never is.”
How scared should we be? Maybe the better question is: How does the stock market measure our fear? Let’s assess.
By the digits
$1.3 trillion: Market value lost on Aug. 5, 2024, in the S&P 500
142%: Percent by which the VIX increased on Aug. 5 as global stock markets hit a rout
65.73: High the VIX hit on that day
2020: Last year the VIX was that high (during March, when COVID-19 panic shook the market)
114,000: Jobs added to the U.S. economy in July, a far cry from the 175,000 expected, and a discrepancy that rattled investors
27.71: Close of VIX on Aug. 6 after markets recovered
Charted

Origin story
The CBOE Volatility Index
The Chicago Board Options Exchange’s CBOE Volatility Index, or VIX, is a real-time measure of unpredictability on the S&P 500 (an index of the largest publicly traded companies in the U.S.). Created in 1993, the VIX is a pulse check on how likely investors think it is that stock prices will shoot up or down over the next 30 days. It’s a bit of an inversive gauge: if the VIX is down, stocks are usually going up and so are moods; if the VIX is up, stocks are generally falling and internal alarm bells are going off.
The highest the VIX has ever reached was 89.53 on Oct. 24, 2008, a.k.a. peak financial crisis times, and its highest close was 82.69 on March 16, 2020, a.k.a. peak pandemic times. While the VIX has never reached 100, it sure can. It can also fall to the single digits.
We can thank scholar Robert Whaley for developing the VIX. Whaley, “the father of the fear index,” is now the Valere Blair Potter Professor of Management (Finance) Director at Vanderbilt University’s Financial Markets Research Center. He also made a volatility index for the Nasdaq called the VXN.
Quotable
“Over its 14-year history, VIX has acted reliably as a fear gauge. High levels of VIX are coincident with high degrees of market turmoil, whether the turmoil is attributable to stock market decline, the threat of war, unexpected change in interest rates, or a number of other newsworthy events. The higher the VIX, the greater the fear.” — Robert Whaley in 2000 describing the VIX, which is now 31 years old, in a research paper
Where things stand
Pop quiz

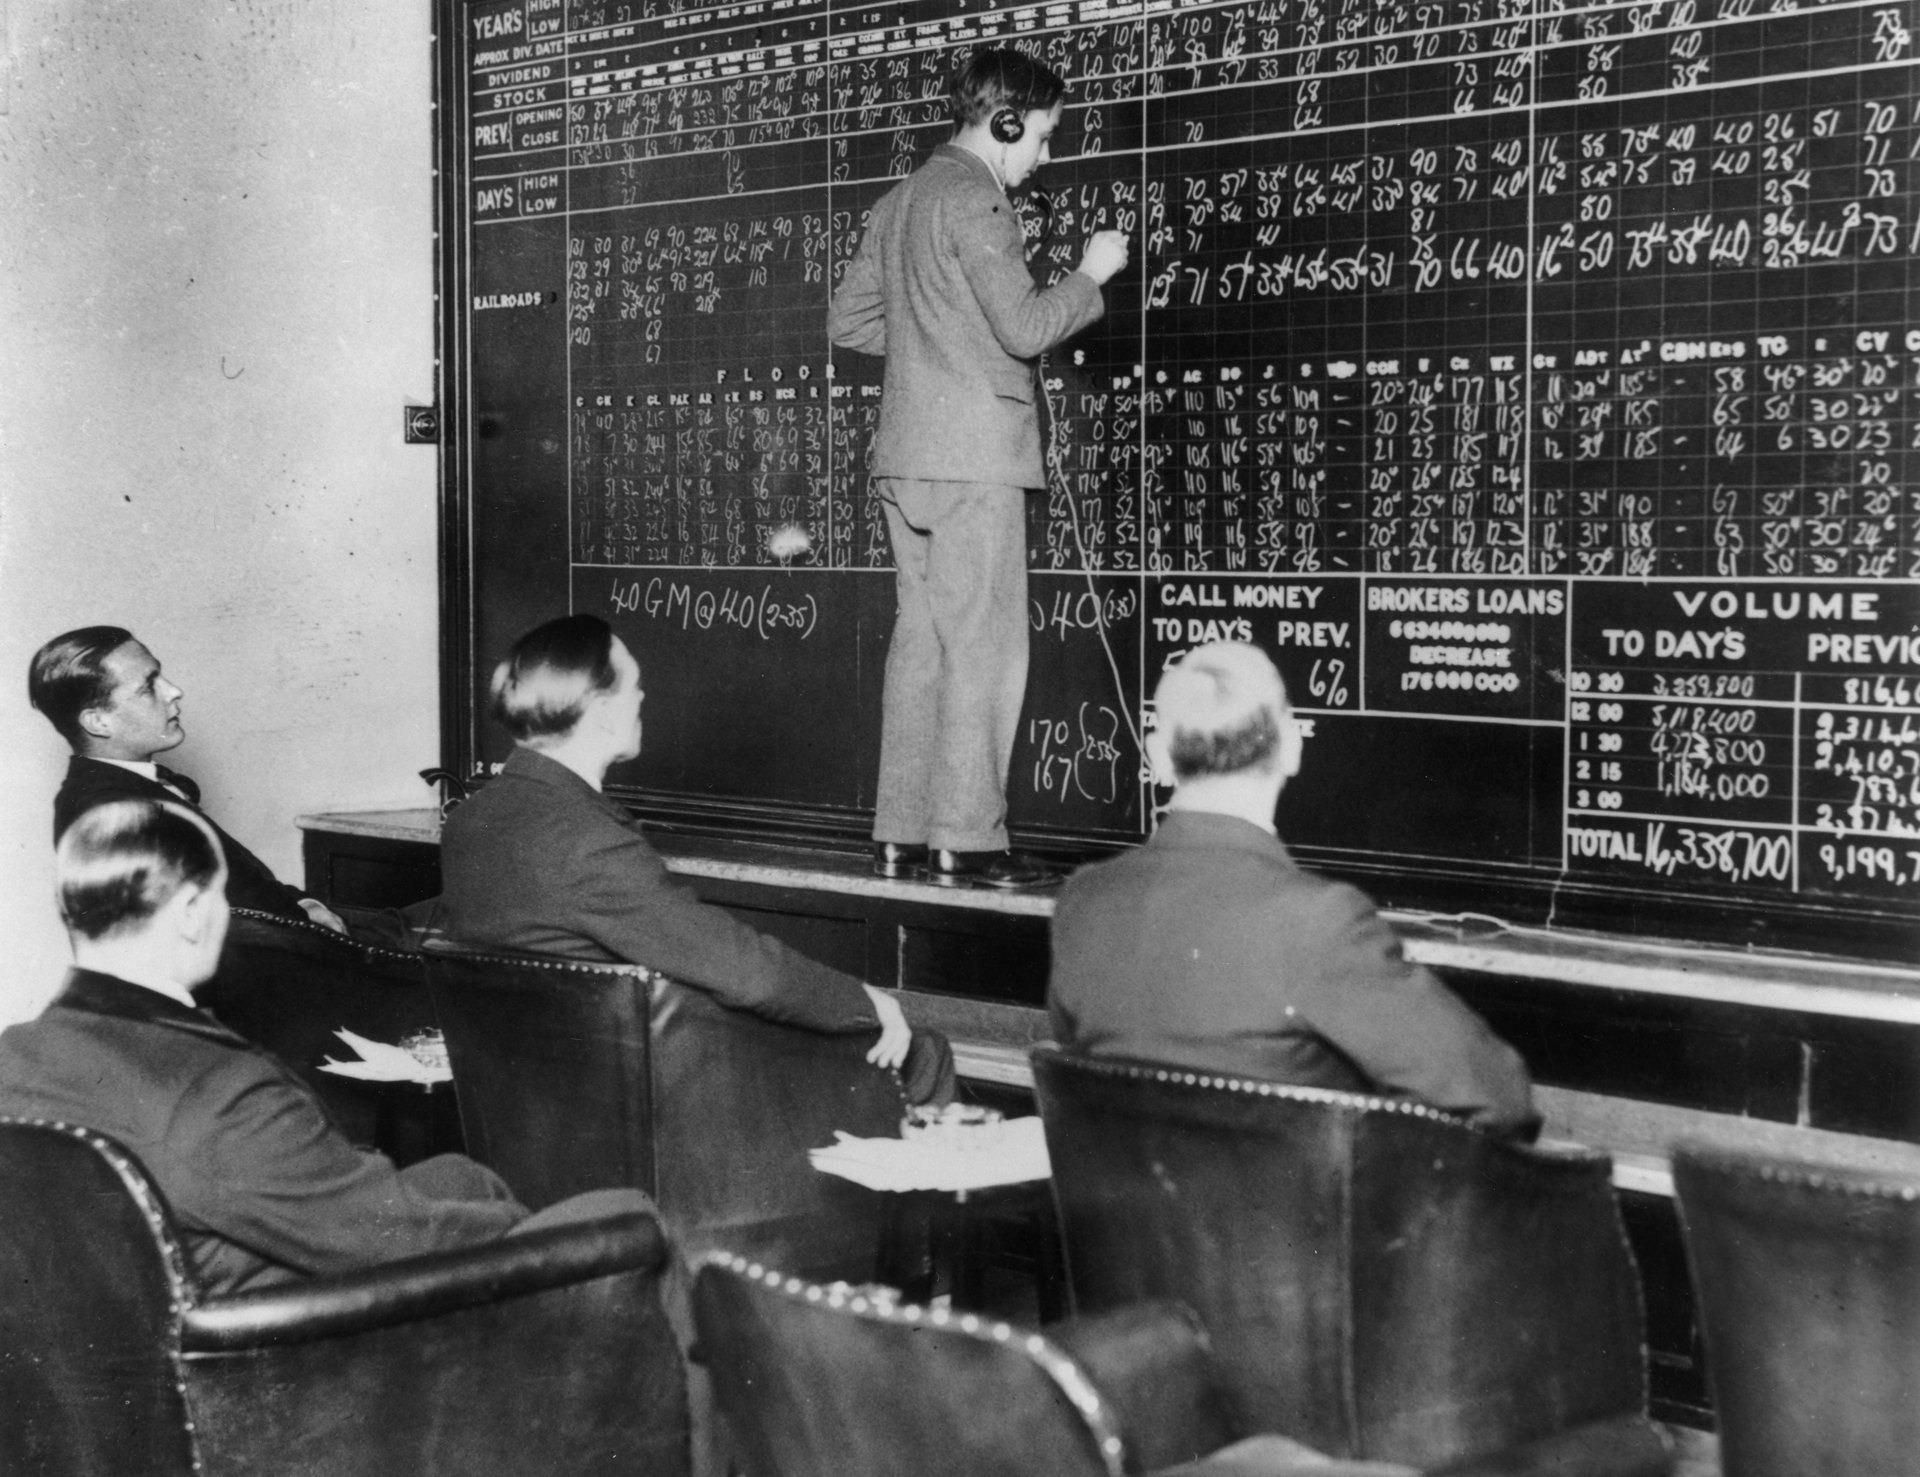
What was the Dow’s lowest point of the 20th century, hit in 1932?
A. 41.22
B. 12.05
C. 100.01
D. 5.63
Crash down to the bottom to find the answer.
Fun fact!
Buying lipstick — or other small indulgences — during times of economic hardship is incredibly common. So much so that the phenomenon has its own nickname: the lipstick index. But in a 2020 article for Quartz, Alexandra Ossola argued that it’s time for the lipstick index to be capped and shoved in a drawer, for good.
Poll

What would you name your fear index?
- The Abyss 500
- Apocalypse Dow
- AHHHHHH
Tell us which one you’d pick. Or, if you have an idea of your own, send it to us.
💬 Let’s talk!
In last week’s poll on the Jungian shadow, the majority of you said you’re not confronting your own shadow because it’s insisting it’s a metaphor.
🐤 X this!
Today’s email was written and produced by Morgan Haefner (is more scared of the wet bulb than fear-filled indexes).
The correct answer to the pop quiz is A., 41.22. Today, the Dow is at over 38,700.