How business leaders can accelerate performance in a winner-takes-most world
A new PwC survey shows how top-performing companies use mutually reinforcing investments to create non-linear advantage, while everyone else plays catch-up.

In a winner-takes-most world, a few companies are vastly outperforming their peers. But what are they doing differently?
Suggested Reading
We surveyed more than 2,000 respondents in the US, UK, Germany, and Australia (interviewees were at the director level or higher at companies with medium revenues of US $650 Million) to find out, quantifying the effect of 40 areas of management practice and company investment—including leadership foresight; investment in business and operating model transformation; the use of technology, including cloud, advanced analytics, and application program interfaces (APIs); and other factors.
Related Content
Separately and in combination, these factors enable leading companies to capture a performance premium—the combined effect of profit margin and revenue growth, in industry-adjusted terms—worth more than 13 times that of their industry peers.
The nonlinear shape of this distribution curve illustrates how companies that develop beyond a threshold level of evolution achieve what we’re calling “quadratic performance” (see the chart below the gray box). If your company isn’t among this top 20%, chances are you’re leaving considerable value on the table.
What we did—and why
To better understand what’s behind top performance we needed to define performance. For purposes of this research, we used two measures: profit margin and revenue growth. Using both measures allowed us to account for important differences in how companies grow profits. Consider, for example, how two companies with identical profit margins but different rates of revenue growth will have profits with very different growth trajectories.
Meanwhile, we also needed to account for the fact that some industries are growing faster than others. We did this by factoring into the analysis both the industry median profit margins and the industry median growth rates. This allowed us to level the playing field and make respondent-by-respondent (as a proxy for company-by-company) comparisons. In all cases, the time frame for our analysis was the respondents’ last fiscal year.
The result was a so-called performance premium—or the combined effect of profit margin and revenue growth in industry-adjusted terms—which we calculated for each of the 2,006 respondents to our survey.
Next—and separately—we constructed an index from the survey results associated with the 40 areas of management practice and company investment that we’d set out to study, for instance:
- leadership characteristics
- investment in business and operating model transformation
- the use of technology
- the use of service partnerships or managed services
Dividing the index into quintiles showed us the degree to which the respondents’ companies were following the 40 practices themselves.
The resulting shape of the distribution was decidedly nonlinear, which led us to name the performers in the top quintile “quadratic companies.”
What are the benefits of achieving this title? Quadratic companies earned an average performance premium of 44% in their last fiscal year. By contrast, the next-best performers (those in the fourth quintile) earned just 9%.
To put it another way, consider the performance of two hypothetical competitors. Both start with revenues of $100. After one year, the quadratic company would have $44 of profit over what would have been earned if the company had achieved the industry medians for profit margin and revenue growth. By contrast, the fourth-quintile company would have earned just $9 of profit over those industry medians.
The benefits of being a quadratic company
To arrive in that top-performance quintile, quadratic companies make mutually reinforcing investments in their business, operating, and technology models, which in turn drive performance factors such as innovation, speed-to-market, and flexibility. All the while, they are lowering friction, or what economists call “transaction costs”—the time and resources needed to do business inside the organization and as companies engage and interact with external parties.
These interactions occur on two interrelated dimensions:

- Business ecosystems:
As technology disruption blurs industry and supply chain boundaries, lower transaction costs boost leading companies’ ability to participate in business ecosystems. And participate they do: top-quintile companies are more than twice as likely as lagging companies to get most (at least 60%) of their revenues from ecosystems, according to our research. By contrast, companies with high transaction costs (or what the author Cass Sunstein calls “sludge”) often struggle to make the most of the valuable, cross-company data flows that ecosystems generate. - Service partnerships:
Leading companies are also more likely to turn to service partners, or managed services, for at least three reasons. First, to help close their capability gaps by accessing technology expertise and global pools of talent (although companies can also close capability gaps through M&A); second, to minimize capital costs; and third, to support sharper strategic focus on their competitively differentiating activities. There is, of course, a cost to using any third-party service—not just the fees charged but the cost of interactions across company boundaries. By lowering their transaction costs, leading companies address capability gaps through their service partner relationships at a lower expense than their lesser-performing peers.
The graphic below helps visualize the dynamics of this larger system in which leading companies participate in business ecosystems and engage service partners to set in motion beneficial data flows, privileged insights, and the combined customer value propositions that help span traditional industry boundaries more seamlessly.
Quadratic companies operate “inside and out” with ecosystems and service partners

A granular view
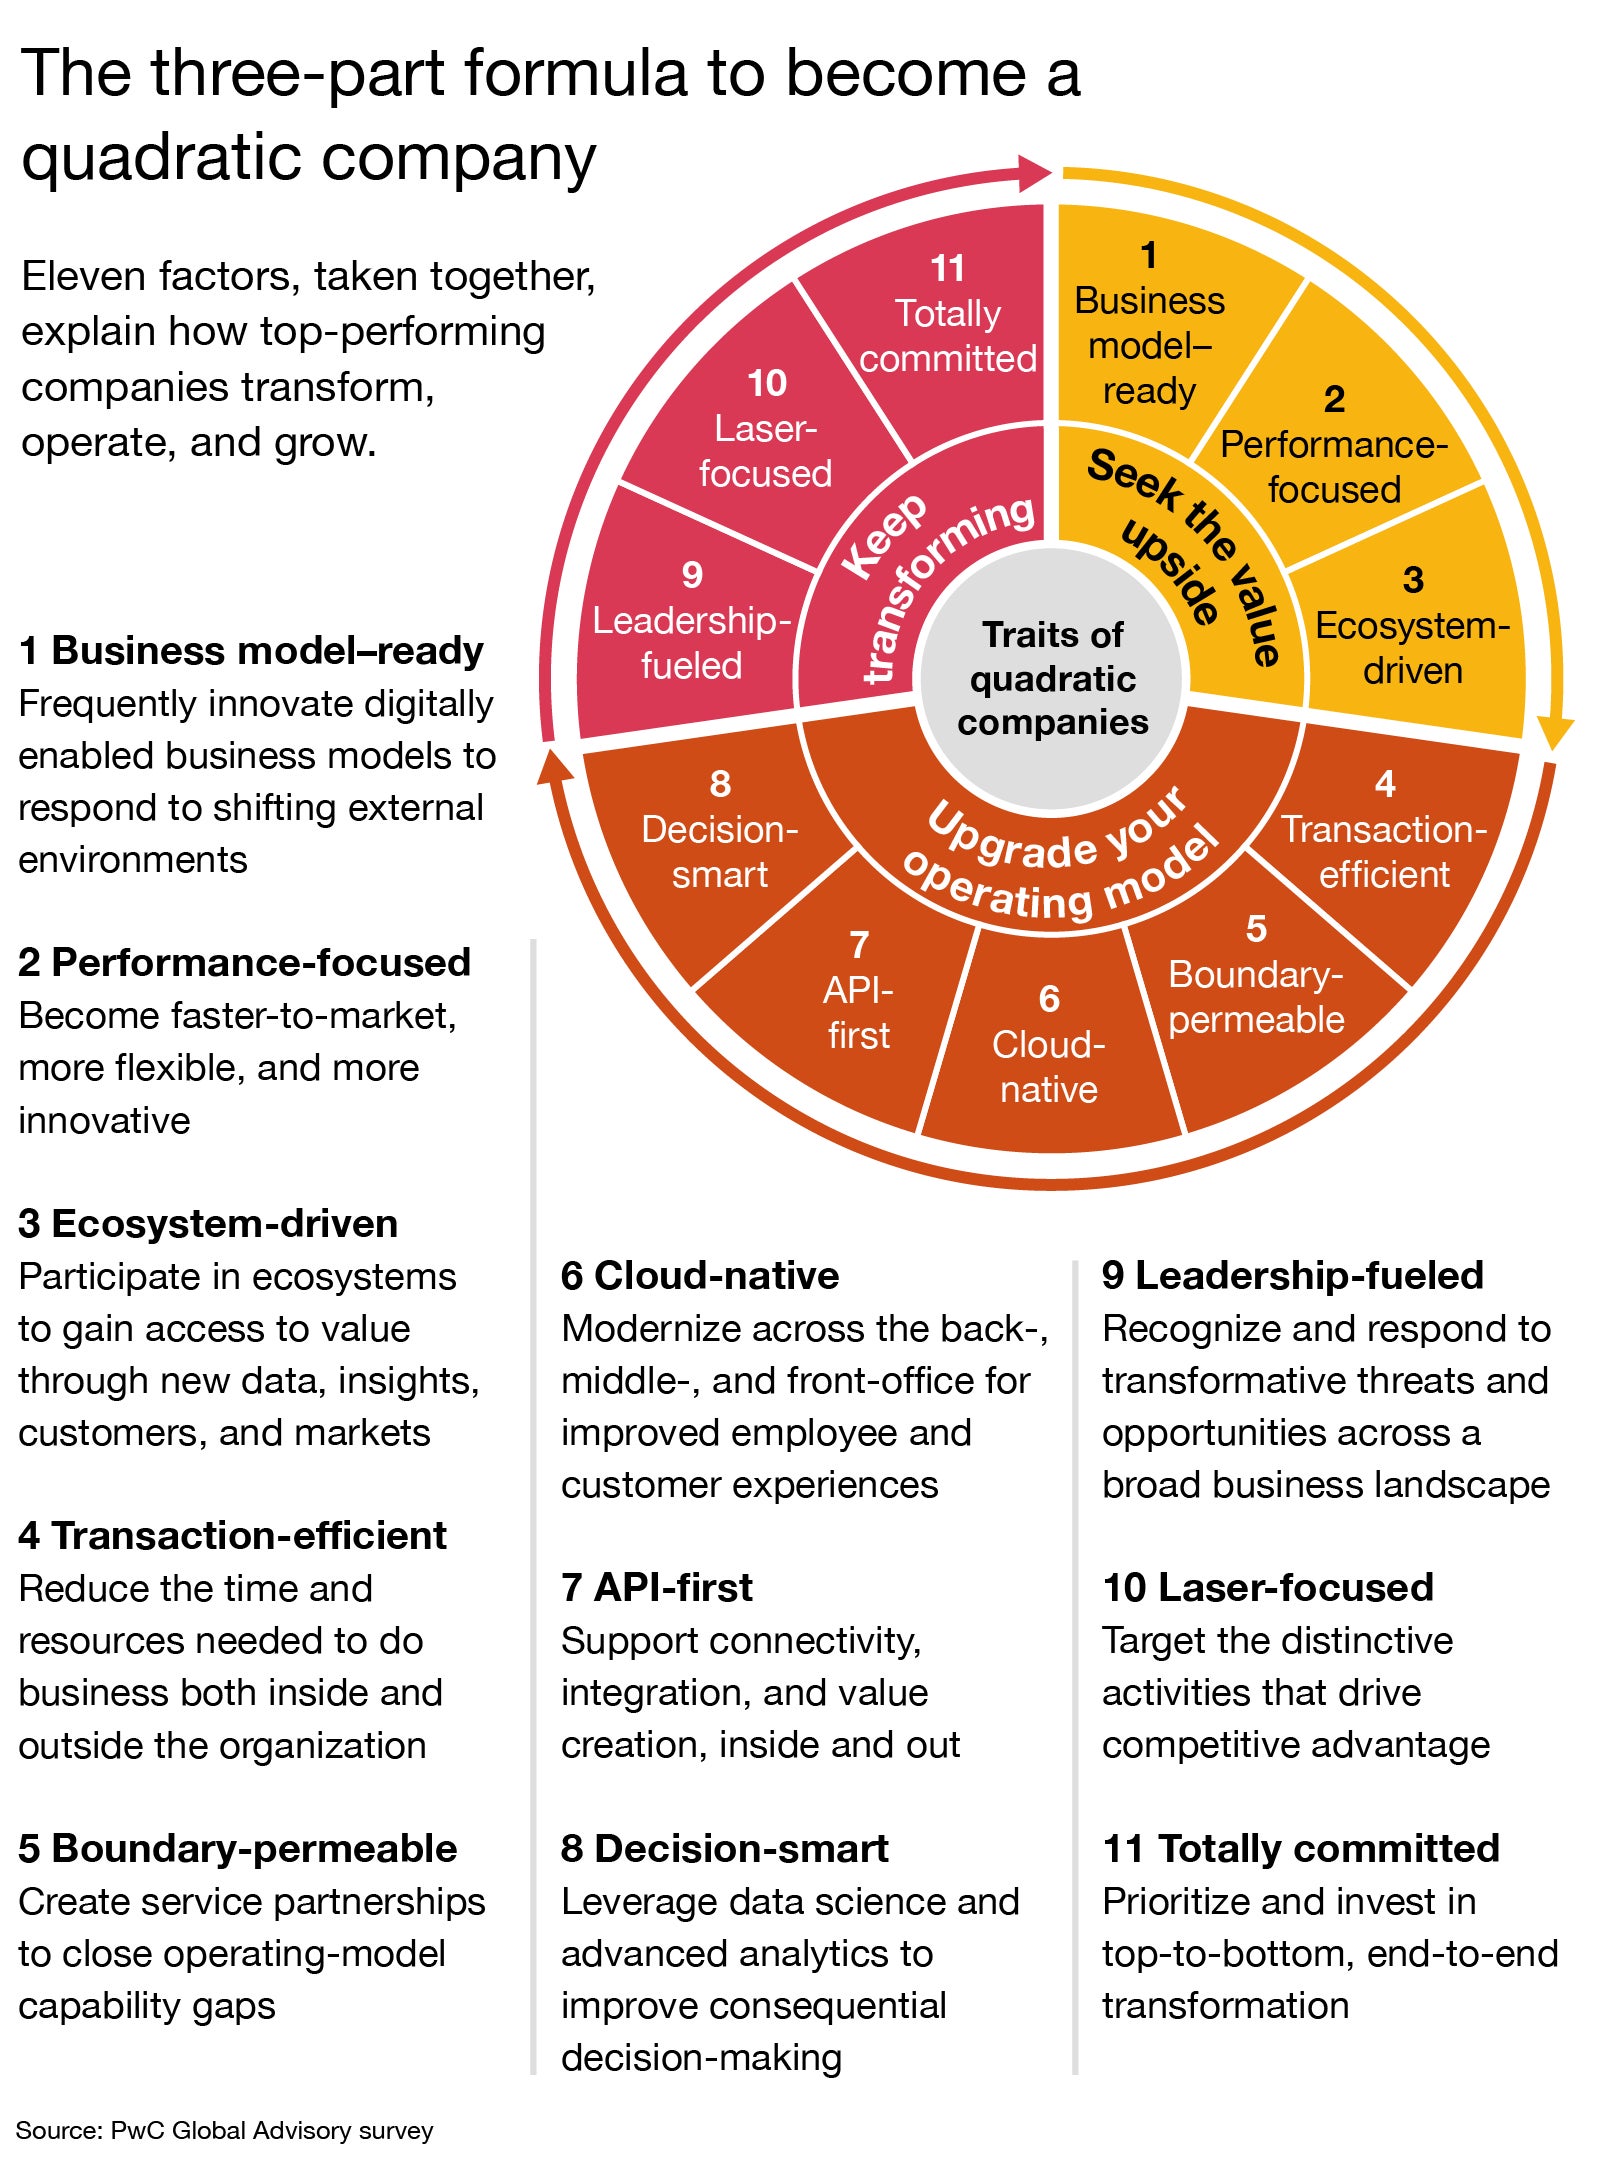
Our research doesn’t just describe the dynamics of a larger system; it also provides a more granular perspective on success, revealing a series of 40 interrelated practices, initiatives, and investment areas that roll up to 11 action items shown in the wheel graphic below. At one level, these elements may look familiar. But top-performing, quadratic companies put this formula into play in two differentiating ways.
First, they approach each of these initiative and investment areas more comprehensively, meaning they pursue them beyond a threshold level of maturity or evolution. For instance, they don’t just migrate certain aspects of the business to cloud; they move entirely to cloud-native technologies.
Second, they approach this formula in the combinatorial fashion necessary to set positive feedback loops in motion. For instance, winning companies are more than seven times as likely to invest in service partnerships to close capability gaps and keep pace with technology advancements—which in turn allows them to focus on what they do best.
The reinforcing effects of investments in service partnerships (to enable strategic focus) contribute to financial outperformance, which frees up more money to, among other things, continue investing in their areas of differentiating advantage while leaving service partners to do the rest.

Getting there from here
Top executives can start by mapping which quintile they’re in, an analysis that will also help reveal areas in which they might be lagging the leaders. Most executives will find that strategic focus is required. Leading companies are 23% more likely than other companies to indicate they concentrate only on the distinctive activities that drive performance. They are also 21% more likely to engage service partners to tackle less distinctive activities and thus free up resources for more differentiating ones.
Divestitures are another way to support strategic focus. As companies sort out what’s core to their competitive differentiation, they may look to divest non-core assets and thereby free up resources. Whether they’re freeing financial and human capital through the use of service partners or divestitures or some combination of both, though, companies will need a dynamic allocation approach to make sure those resources are put to more productive uses.
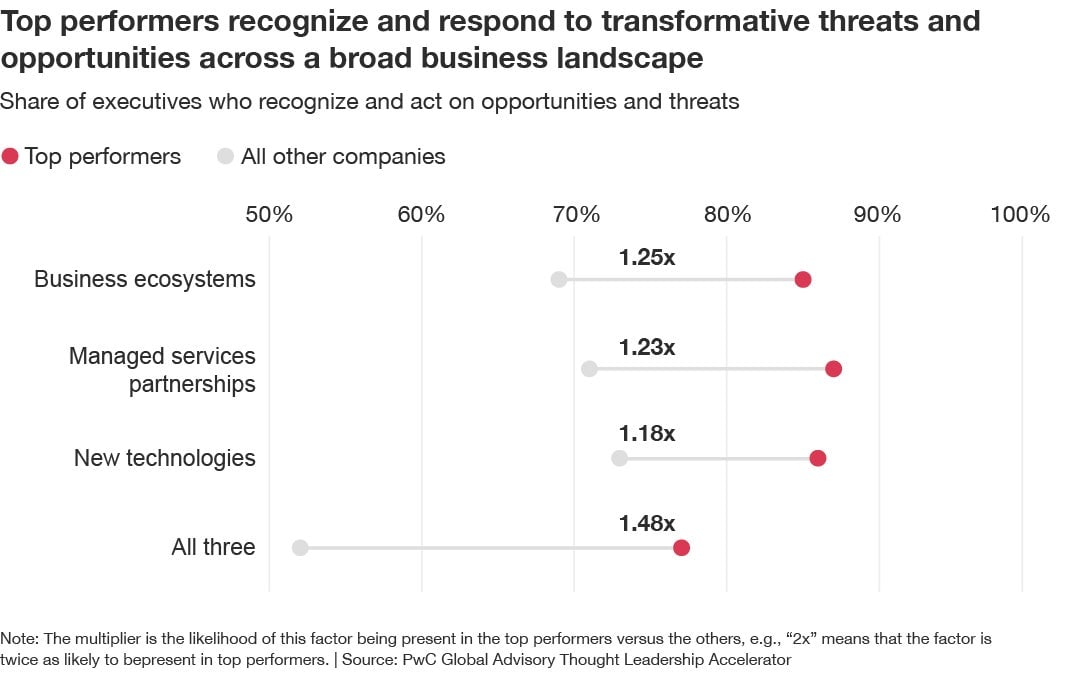
But top executives should also take a hard look at their own leadership approach. Quadratic companies are nearly 50% more likely than other companies to have leaders who recognize and act on the threats and opportunities that emerge from business ecosystems, service partnerships, and new technology. Upping your leadership game may require greater tech literacy and a willingness to make tough investment decisions in service of spurring transformation.
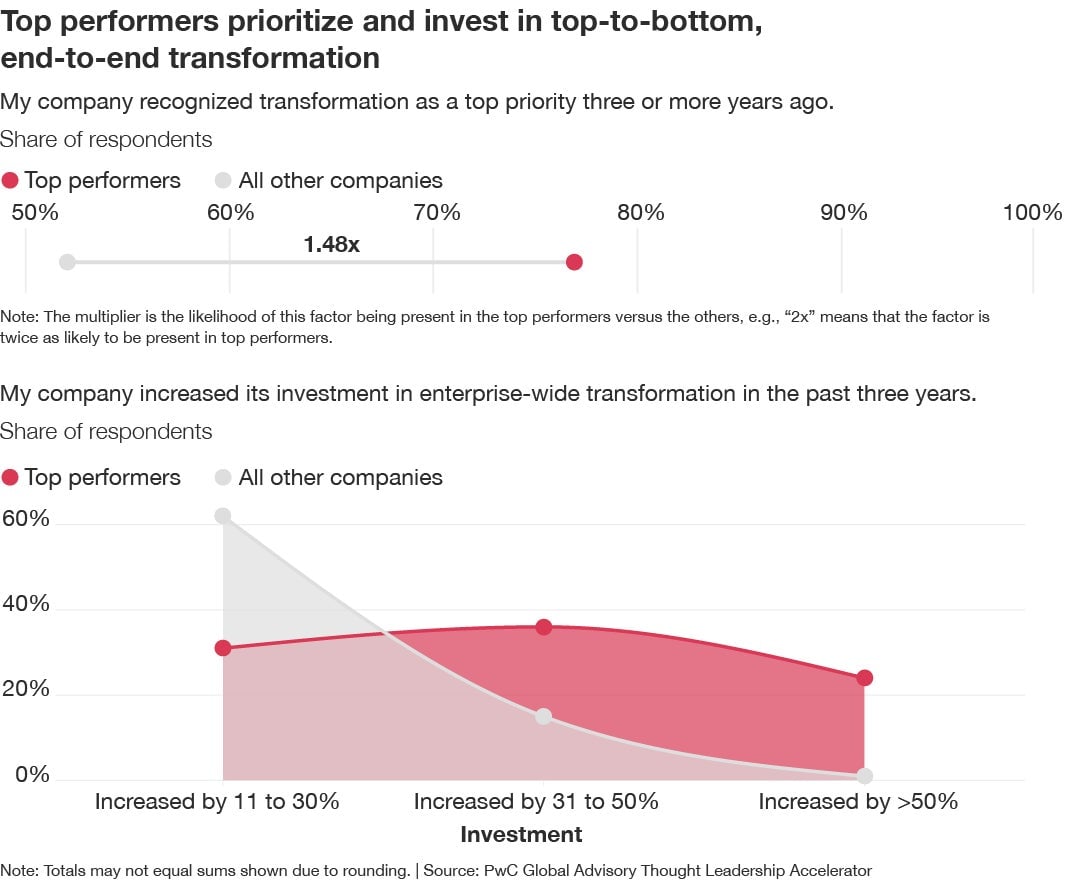
Our research suggests that top-to-bottom, end-to-end transformation will be necessary—at least for those areas you’ve yet to transform. It’s about not just your business model, but the operating and technology models that enable it—and extending across the back, middle, and front offices of your organization.
Companies that transform—and keep transforming, by putting their resources against opportunities and threats—are most likely to join leaders capturing the spoils in a winner-takes-most world.
Get the latest PwC insights delivered straight to your inbox. Sign up now!
About the authors: Mohamed Kande is Vice Chair PwC US - US Consulting Solutions Leader, Global Advisory Leader, and CEO of the US and Japan Consulting businesses. Lang Davison is managing director of global thought leadership in PwC Global Advisory.
This article is a collaboration between G/O Media Studios and PwC. The survey’s 2,006 respondents were director level or higher at companies with median revenues of US$650 million. This article was originally published on Strategy + Business: A PwC Publication
