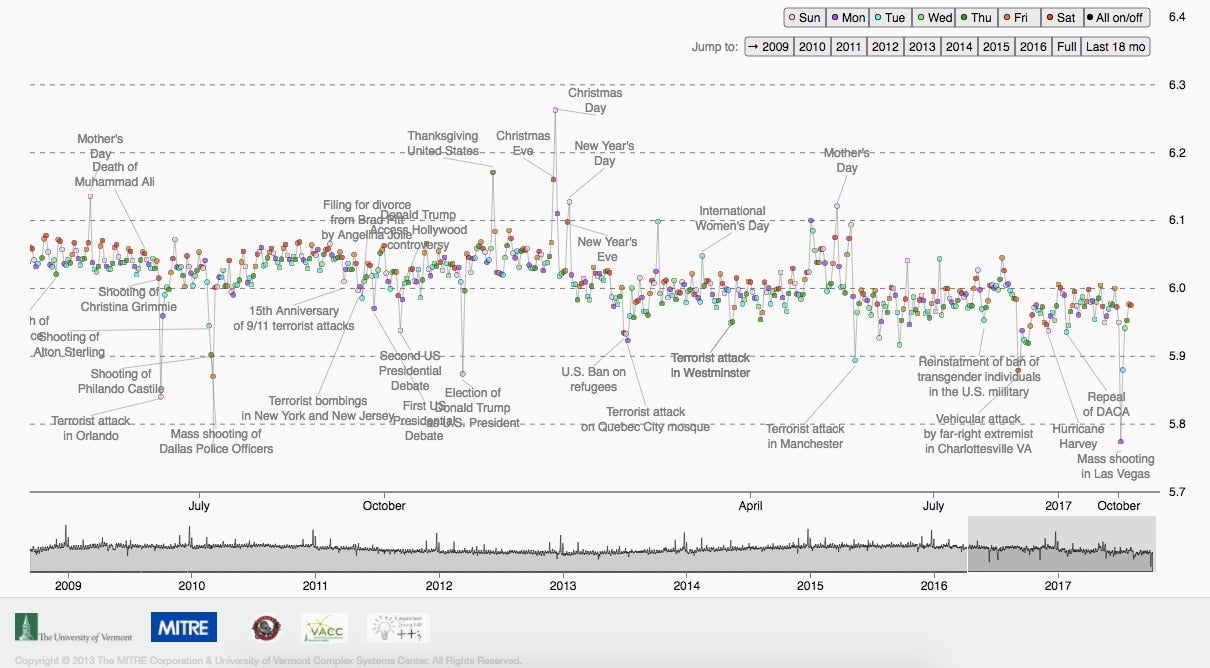
People who are miserable on Monday have lots of company. It’s the worst day of the week for millions, according to researchers at the University of Vermont Complex Systems Center who analyze Twitter messages for happiness sentiment. Mood tends to improve during the rest of the week, peaking on Saturday, before beginning to crash again, according to data based on tweets since 2008.
People who are miserable on Monday have lots of company. It’s the worst day of the week for millions, according to researchers at the University of Vermont Complex Systems Center who analyze Twitter $TWTR messages for happiness sentiment. Mood tends to improve during the rest of the week, peaking on Saturday, before beginning to crash again, according to data based on tweets since 2008.
Even cartoon cats know Monday sucks, but the sheer (and increasing) amount of data that’s available every day, combined with improving techniques for analysis, could offer new insights into society. And while there are many instruments for measuring things like wealth and productivity, ideas like “happiness” for large populations have been more difficult to pin down.
Join 500,000+ readers who start their day with Quartz.
By subscribing, you agree to our Terms of Service and Privacy Policy.
In this analysis, the university’s “hedonometer” takes a random sample of about 50 million Twitter posts each day, which is roughly 10% of all the site’s message traffic. The researchers have assigned average scores to more than 10,000 commonly used words (from 1 to 9, on a scale of increasing happiness), which are used to measure a particular day’s happiness.
The data can also offer some insight into how populations have responded to major events. The day after the mass shooting in Las Vegas on Oct. 2 was Twitter’s saddest day on record, according to the University of Vermont research. Another low was recorded on May 2, 2011, when Osama Bin Laden, the terrorist mastermind behind thousands of murders, was killed. Rather than clear positivity, language used on Twitter “reflected that a very negatively viewed character met a very negative end,” according to the researcher’s website.
Bigger, more powerful data sets offer promise for policy making in a number of ways. Government data seems comparatively slow and unwieldy—the Bureau of Economic Analysis releases multiple estimates of quarterly economic growth based on data that’s so messy it can be substantially revised.
But a better understanding of society’s sentiment could result in even more profound changes. Do jobs, wages, and economic growth translate into human contentment? The University of Vermont’s analysis suggests happiness, at least as measured on Twitter, may have actually trended down since the end of the last recession. If we want to be happy, data science suggests we may not even be asking the right questions.
