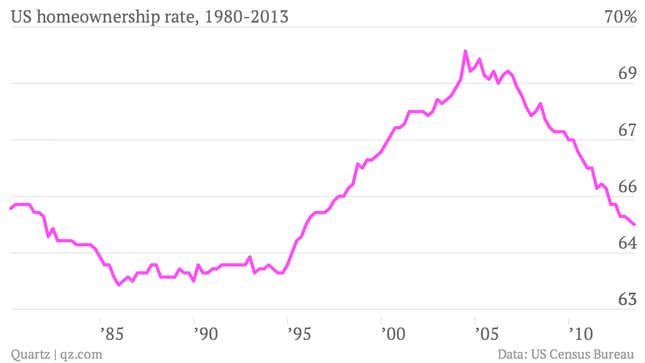
Here’s a chart with explanatory power.
The latest quarterly homeownership data released this morning from the US Census Bureau show the metric—the proportion of homes owned by the people who live in them—hitting 65.1%, its lowest level in 18 years. Homeownership topped out at 69.4% in the second quarter of 2004.

Of course, the housing boom and bust are the subject of myriad interpretations. The Fed kept rates too low. The government pushed home ownership too hard. The banks preyed on Americans with dodgy mortgage products. Consumers borrowed too wildly.
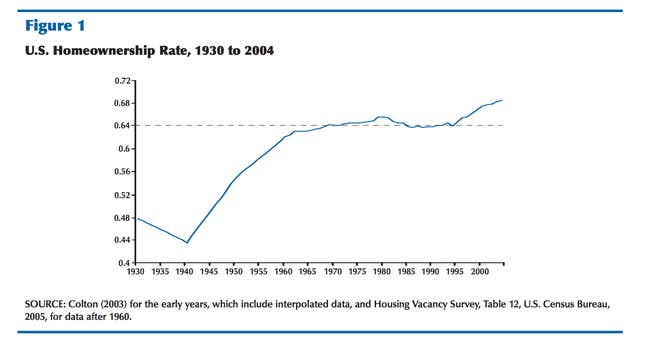
From our perspective, the interesting thing is that homeownership is still a little bit too high, at least by the recent history. Check out this chart, published by Fed researchers during the height of the housing boom back in 2006. It shows that homeownership rose steadily until about 1965 when it plateaued around 64%. Homeownership hugged 64% for 30 years before moving higher.

So the question is what happened to cause that sudden rise in 1995? The Fed’s researchers go through a whole list of possible reasons for the lift, from demographics to mortgage rates to housing policy decisions.
Of all these explanations, we find that the most plausible explanation is that innovations in the financial markets increased access to mortgage finance, mainly by reducing downpayment constraints and allowing younger people to buy homes.
As we now know, those “innovations” were basically the risky loans that nearly tanked the financial system. There’s considerably less lax lending going on right now. But if you go by the 64% homeownership mark that prevailed for roughly 30 years before risky lending started to change the game, the current 65.1% homeownership rate still looks a bit elevated.


