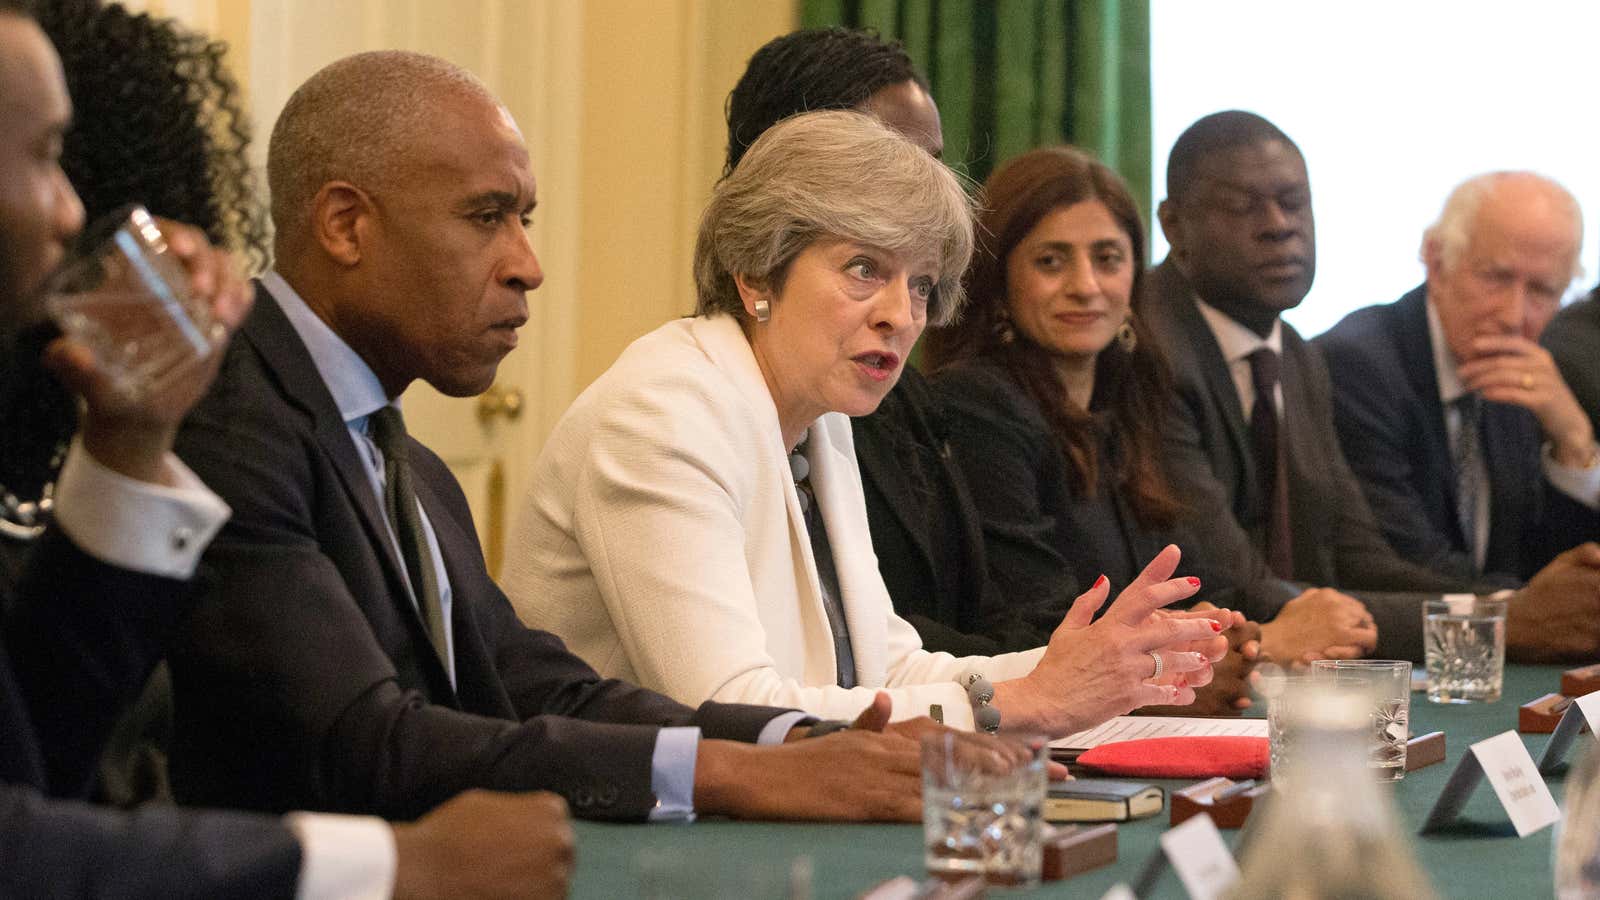
The British reputation for being cold, unfeeling and sporting a stiff upper lip is being dismantled by the UK government as it decides to dive into some uncomfortable truths. This week, the government launched a website that is dedicated to collecting and tracking statistics of racial disparity across the country.
Discrimination and issues surrounding race have long existed in the UK, yet the subject is rarely part of public debate. The new site is designed to force discussion in public and private institutions. This is the first time the data it presents has been collected into one place and presented so clearly.
What emerges is an interesting picture that is far from black and white. In some situations, ethnic minority groups outperform the white British population, in others they are left far behind. There are also instances of large disparity between ethnic minorities. In the UK, 87% of the population identify as white, and the majority of other people are black (mostly of Caribbean or African descent), Asian (includes Indian, Pakistani, Bangladeshi, and Chinese), or mixed race.
The new site is part of an audit announced by Theresa May when she became prime minister last year. She has repeatedly tried to focus on social domestic issues but Brexit dominates her government’s attention. “People who have lived with discrimination don’t need a government audit to make them aware of the scale of the challenge.” May said this week. “But this audit means that for society as a whole—for government, for our public services—there is nowhere to hide.”
The site presents the data without any commentary. It covers crime, justice, health, culture, community, housing, education, employment and income, with breakdowns across location and ages where possible. Here are some of the insights on economic issues:
Unemployment
The average unemployment rate across the UK in 2016 was 5%. Among whites, it was 4%. The next lowest was among Indians, whose rate matched the national average of 5%. But for the black, Bangladeshi and Pakistani population, the unemployment rate was 10% and 11% respectively.
As is typical, rates among young people are much higher. Here, too, ethnic minorities are hit hardest: Among people aged 16 to 24, the unemployment rate was 23% for minorities, nearly double that of whites, for whom the unemployment rate is 12%.
Income
In the last three months of 2016, the average hourly pay in the UK was £13.69 ($18.06). In this period, Indians earned the highest wage at £15.81 per hour, compared to those of Pakistani and Bangladeshi descent, who received the lowest pay at £11.42.
Since 2013, the pay of Indians has tended to be the highest of all the ethnic groups and Pakistanis and Bangladeshis have tended to have the lowest. A summary of the findings on the new site by the Cabinet Office (pdf) and other information hint at some reasons.
The employment rate for those of Indian background is 73%, compared to just 54% for Bangladeshis and Pakistanis, who were more likely than any other ethnic groups to be concentrated in the three lowest-skilled occupational groups. Meanwhile, Indians were the most likely to work in the highest-skilled groups, with more than 1 in 10 workers in manager, director and senior official roles.
Additionally, just over half of those of Pakistani and Bangladeshi background were born in the UK. (By comparison, 98% of the white population and 94% of the black Caribbean population were.) This means many are immigrants subject to the UK’s strict rules, which require you to have a job, be going to study or live with a family member. India is by most measures a richer and better educated country, making it more likely that people enter the UK through these first two routes.
Location is also likely to be a factor once in the UK. The Cabinet Office report said: “The ethnic minority population is more likely to live in areas of deprivation, especially Black, Pakistani and Bangladeshi people.”
Still, more broadly there are signs of income inequality between races. Among households headed by a white person, 11% suffered from persistent low incomes, compared to 25% among black households and 22% among Asian households.
Income distribution
In the UK, people are split into five income groups. The lowest group had an average income after housing costs of £8,800 in 2015/16, and the highest an average income of £45,700. Over half of Asian and black households fell into the lowest two income quintiles.
Home ownership
Owning your own home—and being able to pass it on down to family members—is an important part of building wealth. Inequality here can end up persisting through generations. In England, about 14.3 million of 22.6 million households own their homes, or 63%.
Sixty-eight percent of white British households were in owner-occupied homes and were more likely to be than other ethnic group across every measure of socio-economic status, income band, region and age group.
Indian and Pakistani households also showed high rates of ownership. Meanwhile, black and Arab households had incredibly low levels of home ownership.
Education
Higher levels of education fail to offer a path away from racial inequality. As the Cabinet Office report notes, students in several ethnic groups outperformed white British pupils in school. However, there is a clear link between lower education attainment and economic disadvantage.
Students from ethnic minorities who completed their initial schooling at 18 were more likely than their white peers to immediately go into more education.
Even as the current Conservative government has created this site to effect change, it has been charged with creating policies that adversely impacted ethnic minorities. A report published this week by the Runnymede Trust and the Women’s Budget Group, says changes to taxes and benefits since 2010 are set to hurt women from ethnic minorities the most. The report estimates that by 2020, government policies will cause black and Asian households in the lowest income quintile to experience a drop in living standards of 19% and 20%, respectively.
