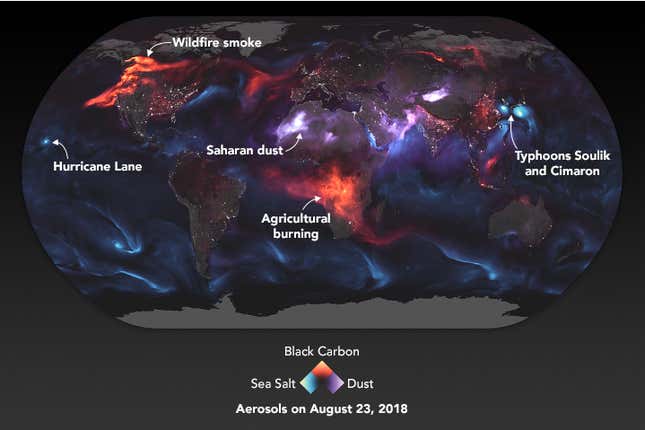
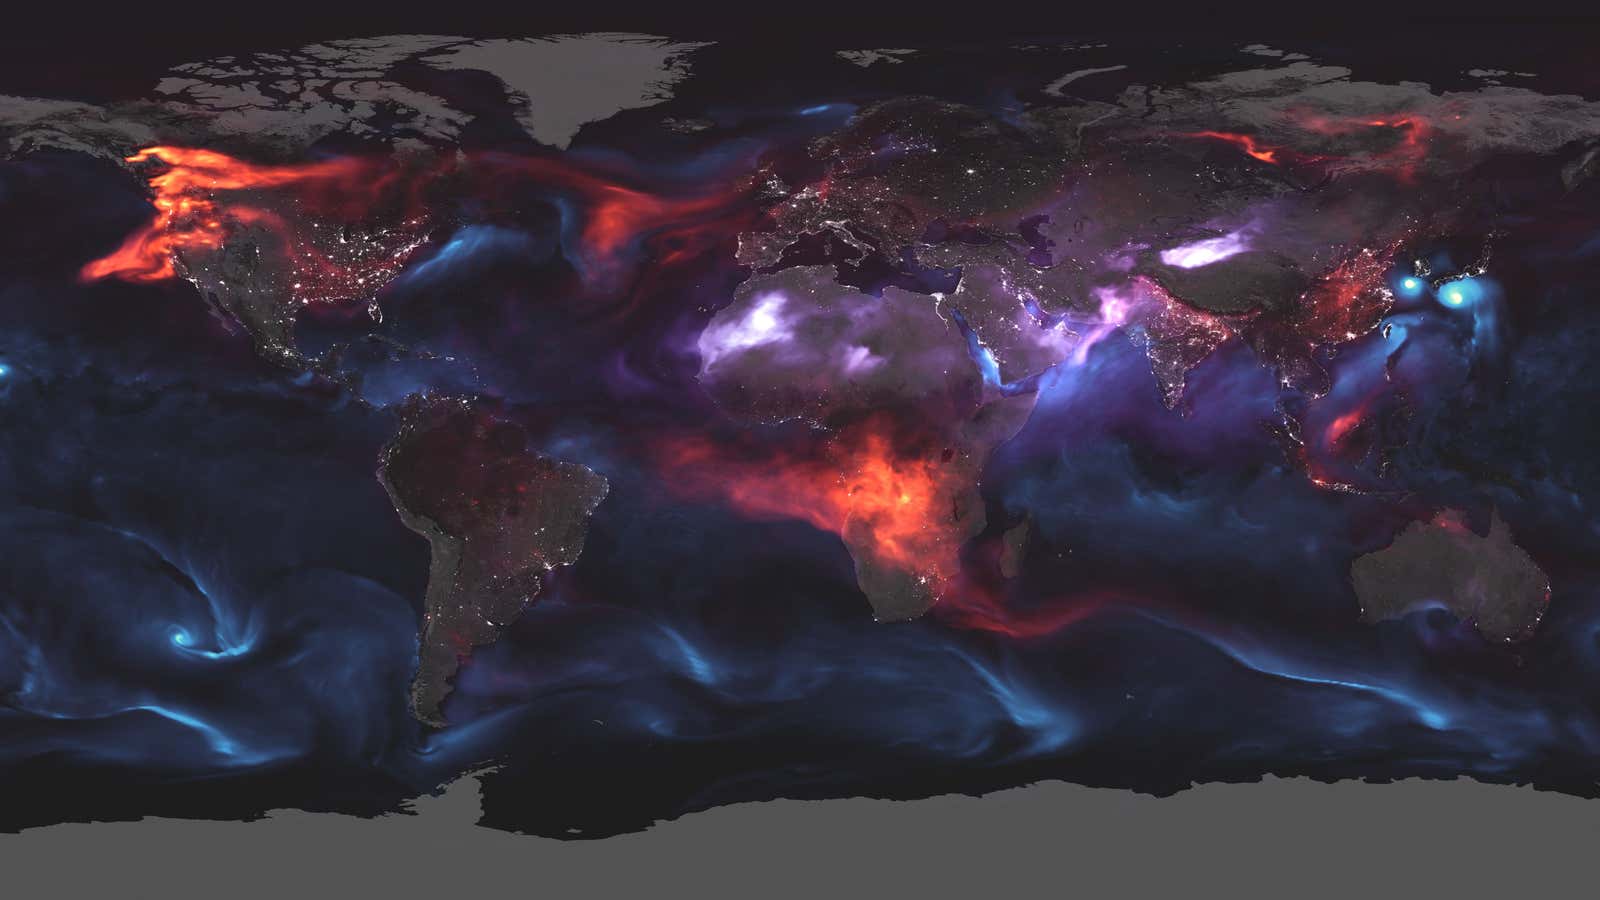
Each time you breathe in, “it is nearly certain that you will inhale millions of solid particles and liquid droplets,” writes NASA in a release accompanying a visualization of satellite data showing how the Earth’s atmosphere looked on August 23, 2018.
The color images depict the massive plumes of smoke that rose above wildfires raging on the West coast of North America that day, as well as smoke over sub-Saharan Africa from seasonal agricultural burning. The black carbon from those fires is pictured in red.
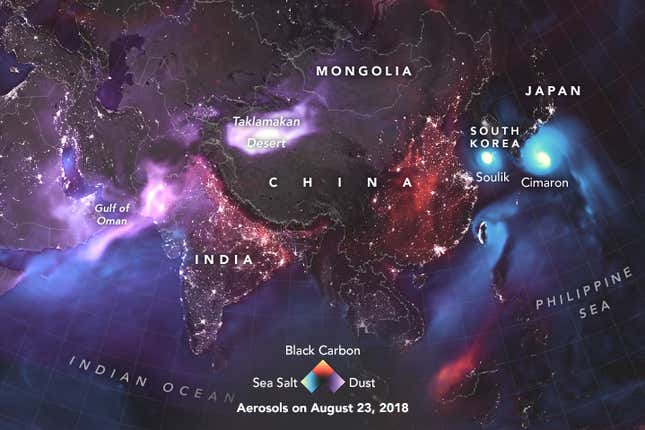
They also include swirls of suspended sea salt, pictured in blue, churned up by storms over water; on August 23, Hawaii was anticipating Hurricane Lane, and off the coast of South Korea and Japan, two typhoons—Soulik and Cimaron—were about to make landfall.

Meanwhile, dust particles swirled over the Saharan desert in Africa and the Taklamakan desert in Asia, pictured in purple.
All particles suspended in air are broadly called “aerosols,” and NASA’s Terra, Aqua, Aura, and Suomi NPP satellites are designed to observe these aerosols from their orbits far above Earth’s surface.

The images aren’t the direct output of what satellites are seeing, however, but rather the work of a NASA modeling system called the Goddard Earth Observing System Forward Processing (GEOS FP). The GEOS FP “used mathematical equations that represent physical processes to calculate what was happening in the atmosphere on August 23,” according to NASA The observations made by the Earth-observing satellites get folded into that model in order to generate the most accurate visualizations of atmospheric conditions.
