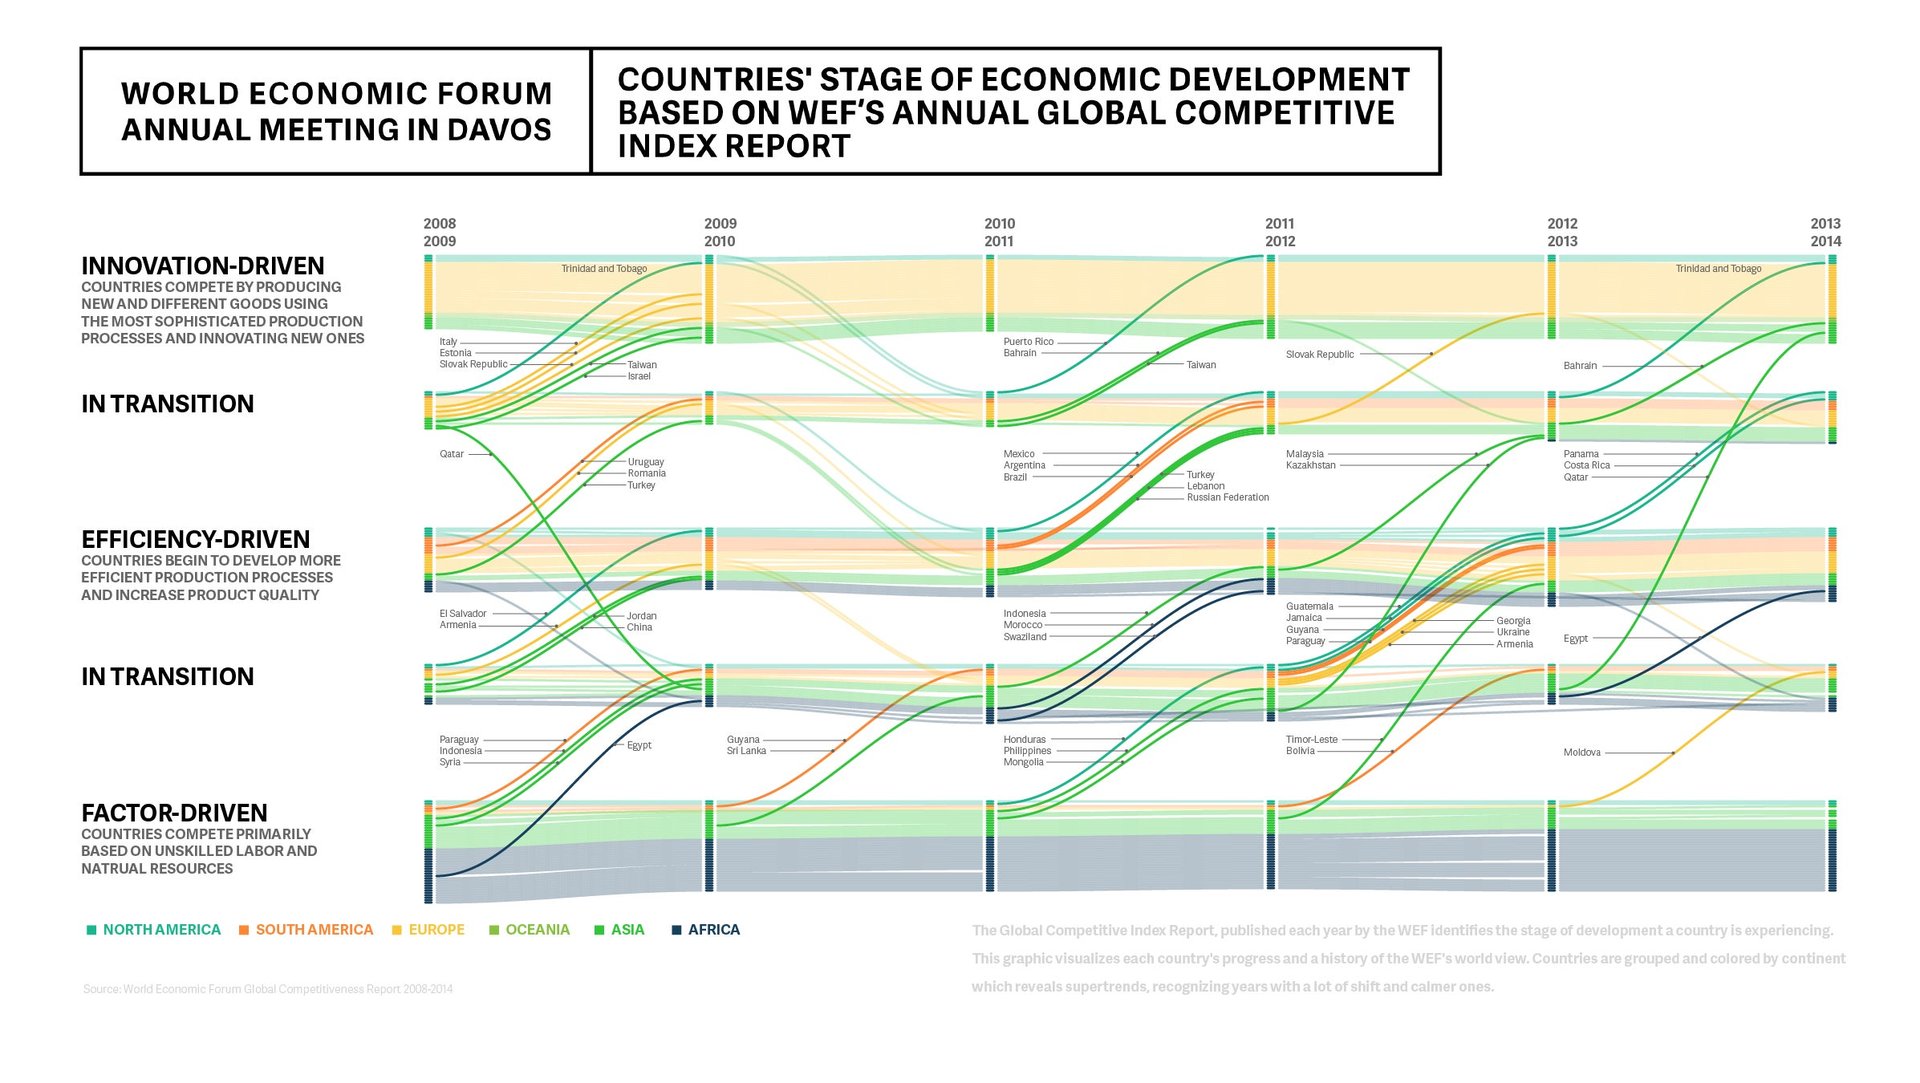
The Global Competitive Index Report, published each year by the World Economic Forum, provides a snapshot of worldwide economic activity and identifies the stage of development each country is experiencing. This graphic visualizes each country’s Index status since 2008, showing annual shifts for individual economies and revealing supertrends, recognizing years with dramatic change. These shifts–and the hope of more acceleration towards “innovation-driven” economies–are on the minds of everyone in attendance at Davos this week.
The Global Competitive Index Report, published each year by the World Economic Forum, provides a snapshot of worldwide economic activity and identifies the stage of development each country is experiencing. This graphic visualizes each country’s Index status since 2008, showing annual shifts for individual economies and revealing supertrends, recognizing years with dramatic change. These shifts–and the hope of more acceleration towards “innovation-driven” economies–are on the minds of everyone in attendance at Davos this week.
(See the infographic enlarged.)
This article was produced on behalf of Bank of America $BAC by the Quartz marketing team and not by the Quartz editorial staff.
Join 500,000+ readers who start their day with Quartz.
By subscribing, you agree to our Terms of Service and Privacy Policy.