A decade ago Sean Reardon, a professor at Stanford, embarked on a slightly insane project to compile and standardize test scores from every public school in the US. Having that data, he and his colleagues thought, would reveal the real gaps in achievement between rich and poor, black and white, boys and girls, and other groups. Armed with these numbers, parents and policymakers could push to make education the vehicle for social mobility it’s meant to be, by highlighting the schools that support kids with high-quality learning and those that don’t.
That project—the Stanford Education Data Archive—is now publicly available as an engrossing interactive tool, incorporating more than 350 million test scores at every single public school serving grades 3-8 in America. Parents can see how their school and district performs on tests, and also its pace of learning over time and in relation to other schools and districts. Policymakers can use it to see which schools are doing well, and which are not, taking in more than just test scores. (Test scores tend to reflect way more than kids’ abilities or the quality of a school, including support at home, early childhood opportunities from care to preschools, after-school programs, and what’s available in the neighborhood.) Kids can use it to support their own activist efforts.
Reardon and a team of researchers have published various papers from the data, including a new one which argues that while racial segregation is a strong predictor of achievement gaps, school poverty—and not the racial composition of schools—accounts for this effect. “While racial segregation is important, it’s not the race of one’s classmates that matters, per se,” said Reardon. “It’s the fact that in America today, racial segregation brings with it very unequal concentrations of students in high- and low-poverty schools.”
At the same time, the group dug into the data to show that many poor schools and districts still produce above-average learning gains for students. Reardon and his team compared Chicago’s Public Schools—famous for high levels of segregation and underperformance—and Maryland’s Anne Arundel County as case studies.
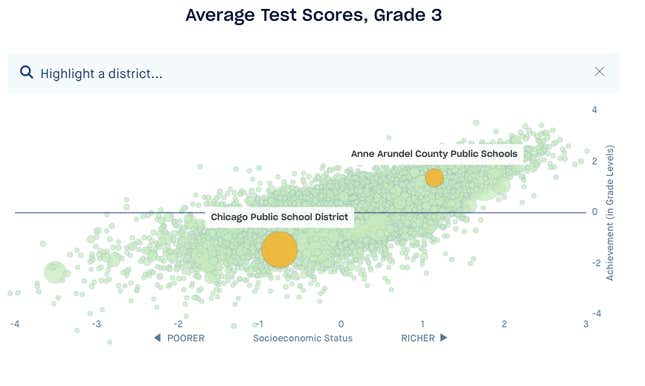
In third grade, the average student in Chicago scores below a second-grade level. As the chart shows, in well-off Anne Arundel County average test scores at the same age are above the grade level.

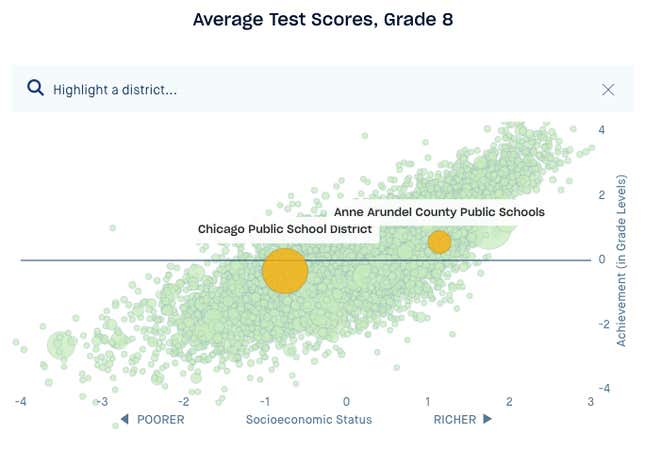
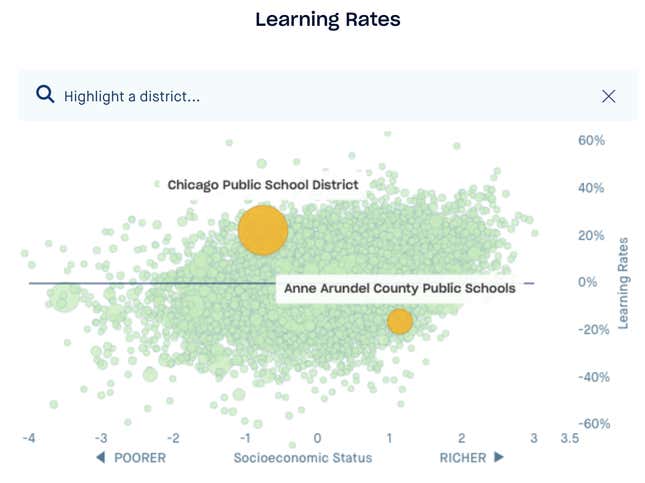
By 8th grade, however, Chicago has caught up and students are performing near the national average, whereas Anne Arundel students have moved down. Chicago students—poorer and less white—experienced the equivalent of six years of average learning in the five years between third and eighth grade. In Anne Arundel, though students are on average wealthier, they learn at a slower rate than their counterparts in Chicago. By eighth grade, their scores are only slightly above average.

Despite differences in the pace of improvement, eighth graders in Anne Arundel still achieve higher average test scores than in Chicago. But Reardon says it is wrong to think test scores are a reliable measure of school quality, and uses an analogy with hospitals to make his point.
“We shouldn’t assess a hospital based on the health of its patients; rather, we should ask how much a patient’s health improves as a result of his or her time in that hospital,” he said. “Similarly, we shouldn’t evaluate a school based on the average scores of its students, but rather by how much students learn while in school.”
Indeed, looking at a map of learning rates between third and eighth grade, instead of a snapshot of test scores in any given year, Chicago looks better, especially considering the lower socioeconomic status of its typical student compared with Anne Arundel.

Most parents would probably still pick Anne Arundel over Chicago, if they could: the test scores are better. But they would be smart to demand more from Anne Arundel, and give Chicago educators’ credit for the work they’re doing.
The dataset offers a powerful tool for parents to see whether their children are learning above or below the average for schools in their neighborhoods. As Erin Fahle, an assistant professor at St John’s University and co-author of the paper on segregation, puts it: “Parents could be strong engines of change in their local areas by giving them more information.”
