People talk a lot about “cyberwarfare” but it’s hard to get a handle on what that means. In October, two German computer security researchers created a real-time map that allows you to see a picture of the online scrum.
People talk a lot about “cyberwarfare” but it’s hard to get a handle on what that means. In October, two German computer security researchers created a real-time map that allows you to see a picture of the online scrum.
The map isn’t out of a techno-thriller, tracking the location of some hacker in a basement trying to steal government secrets. Instead, it’s built around a worldwide project designed to study online intruders. The data comes from “honeypots,” which are computers designed to appeal to the different kinds of malware, bots, and worms that troll the web looking for victims—they’re “insecure on purpose…like a 15-year-old unpatched Windows XP system,” Florian Weingarten, one of the Aachen University researchers, says.
Join 500,000+ readers who start their day with Quartz.
By subscribing, you agree to our Terms of Service and Privacy Policy.
When the bots go after a honeypot, however, they’re really hacking into a virtual machine inside a secure computer. The attack is broadcast on the map—and the researchers behind the project have a picture of how a virus works that they can use to prevent similar attacks or prepare new defenses.
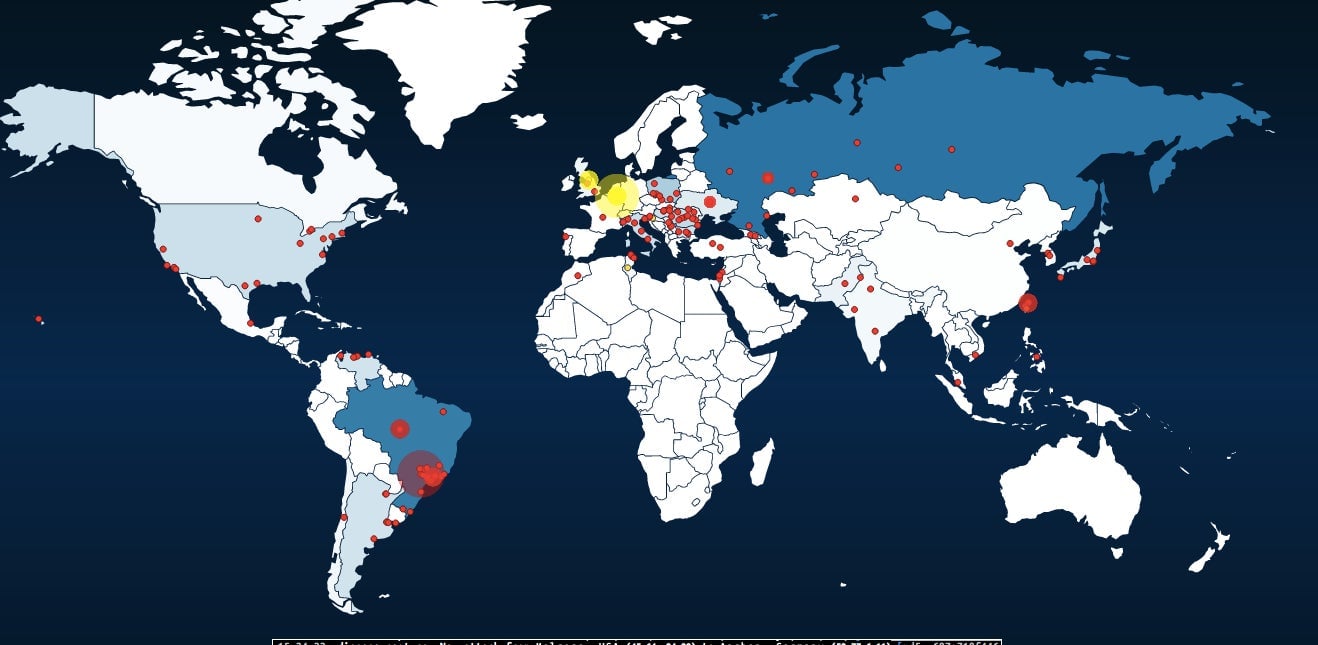
The yellow circles on the map are the honeypots under attack; often, you’ll see Aachen, Germany on the receiving end of attacks, because it’s home to a large honeypot operated by the research group that includes Weingarten and the map’s co-creator, Mark Schloesser. The red dots show the origins of the online attacks.
But you shouldn’t associate those red dots with nefarious behavior. ”Most people are not immediately aware, but the red dots on the map are mostly normal systems of people who do not even suspect that they might be infected,” Weingarten says. “They attack other systems without knowing it. So the lesson to learn here is: keep your own system secure! Keep your software up to date!”