Where NOx is being emitted revealing how humans are transforming their environment
If something is burning, NOx is flowing into the atmosphere. Increasingly, the most concentrated sources of the compounds — nitric oxide (NO) and nitrogen dioxide (NO2) — come from humans burning fossil fuels and transforming ecosystems. Natural sources, such as Australia’s currently raging wildfires contribute too (if those fires can even be considered “natural”).


If something is burning, NOx is flowing into the atmosphere. Increasingly, the most concentrated sources of the compounds — nitric oxide (NO) and nitrogen dioxide (NO2) — come from humans burning fossil fuels and transforming ecosystems. Natural sources, such as Australia’s currently raging wildfires contribute too (if those fires can even be considered “natural”).
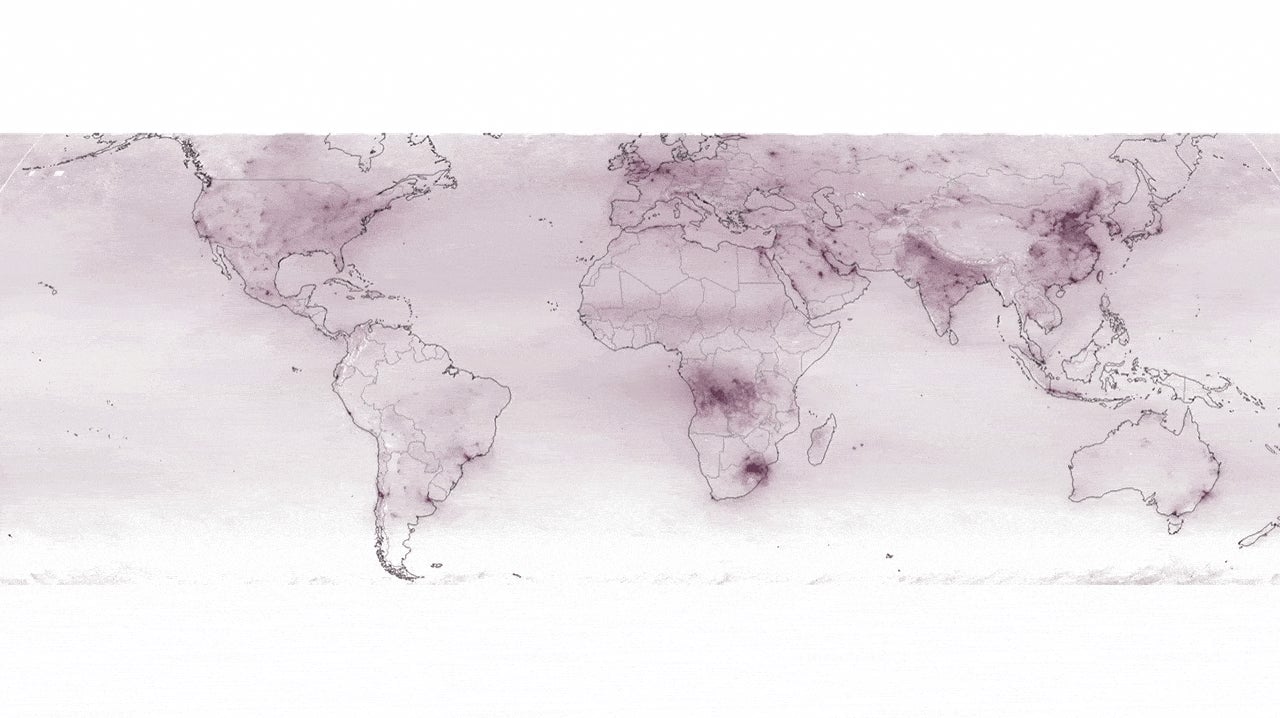
It gets less attention than carbon dioxide, accounting for just 6% of all emissions in 2017. But it’s a major factor showing where humans are transforming their environment. New Mexico’s Descartes Labs, one of the firms refining this remote sensing data into what it calls a “digital twin” of the planet, provided the data for Quartz to create these maps. The snapshots show regions with the most NOx emissions between August 2018 and September 2019. The darkest purple areas show the imprint of the human world.
Polluting activities are plain to see. Power plants in northern China. Ships crossing the Gulf of Aden gateway for Persian Gulf oil. Clusters of factories and coal plants in the small city of Korba, India. Millions of cars and trucks (pdf) in Southern California. Burning fields and grasslands in southern Africa appear to emit almost as much NOx as the coal-powered regions of China’s interior. Winds swirl these emissions together across a vast expanse of oceans and national borders.
Here are some highlights of our invisible burning world.
Burning coal and grasslands in Africa
The burning season in Africa begins in December as the rains trail off in the highlands. As the dry season moves south, away from the equator, the fires come with it. Countries like Angola and Zambia light up a deep purple in the images during August and September as fires there release NOx into the atmosphere. Every year, vast areas of the continent’s central grassland and savannahs burn during seasonal fires and those set by farmers to clear fields in a patchy band of fires (this past year was above average).
Further south, industrializing nations such as South Africa reveal their reliance on coal which supplies 80% of the nation’s electricity. A bright red area near Johannesburg reveal emissions from sources including Medupi Power Station, one of the world’s largest coal power plants. To meet demand, South Africa is slowly making the switch to renewables. Its latest energy plan released this October plans to procure 27.4 GW of new capacity: 50% from wind, 22% from solar, and 16% from natural gas or coal, according to Reuters. But the plan only expects to bring coal’s share of electricity generation down tof 59% by 2030.
India’s capital of coal
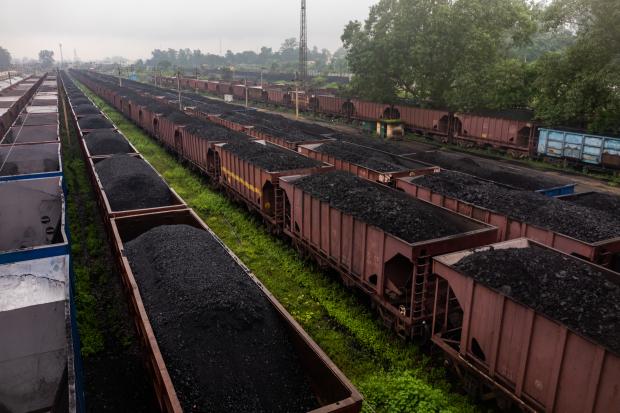
Anywhere you go in Korba, coal is in the air thanks to four coal mines, five coal power plants, and an aluminum smelter. The Indian city of 300,000 people emits more pollution than cities several times its size.

The region, responsible for generating 5% of the country’s electricity, sits at the center of one of the highest concentrations of NOx emissions on the sub-continent. According to Sentinel-5P data gathered between Dec. 2018 and Jan. 2019, the plume around Korba, India is roughly 20 miles wide.
Wind and topography can work together to funnel distant pollution into remote, pristine areas, hundreds of miles from its source, says Laura Mazzaro of Descartes Labs. “People may not realize they’re swimming in pollution from distant cities.” Each coal plant leads to the premature death of 650 people per year, about 20% from NOx, according to estimates (pdf, p. 13) from the non-profit Resources for the Future.
Exporting NOx to China
China has become the world’s largest greenhouse-gas emitter. As Western nations shifted manufacturing to Asia in the 1990s, pollution followed. Today, about 14% of the world’s exports originate from China, much of it between Shanghai, Beijing and Xi’an in the interior, as well as the industrial hub of Guangzhou. These images of China’s east show emissions during the winter months of Dec. 2018 and Jan. 2019. As temperatures drop, energy demands for the 1.3 billion residents increase the burning of coal for electricity and heat.
Seeing the NOx behind the oil
One-fifth of the world’s oil passes through the Strait of Hormuz, a 21-mile wide channel along the coasts of Iraq, Iran, and Saudi Arabia. It borders countries with about half of the world’s fossil fuel reserves, and hosts the shipping lines that move it around the world.
It’s also a region heavily reliant on burning it for energy. Saudi Arabia’s capital of Riyadh is clearly visible in the center of the country. Like much of the region, the kingdom derives most of its energy from burning fossil fuels. Dubai in the United Arab Emirates, Iran, and Iraq all share a heavy reliance on oil and gas. The routes of shipping traffic trace neat lines across the Gulf of Aden where tankers pass every year carrying 18.5 million barrels by sea each day.
Much of these emissions are a result of a globalized economy. As countries like the US rely on exporters abroad to supply their goods, the emissions from shipping coal and oil, as well as burning it to fuel the power sector, are a picture of the globalized economy’s role in a warming world.
Until the launch of the European Space Agency’s Sentinel-5P satellite in 2017, it was difficult to track NOx precisely. But now scientists are getting their first detailed looks at data collected by the satellite. Sensors onboard Sentinel-5P can capture NOx emissions at a resolution of 7 km. That’s one data-point for every small-town-sized area and about three times more detailed than earlier instruments. In just over two weeks, the satellite sends back data spanning most of the globe. Even higher-resolution instruments are slated to come. The Sentinel’s “P” stands for precursor. The next generation of satellites from the European Space Agency and private firms may even be able to identify NOx from individual factories and power plants. The stakes are high: Investors are already calculating the risk of greenhouse gas-emitting portfolio companies and cutting off capital to high-emitting firms.
Update: This story was updated to reflect the fact that emission in this story refer to NOx — nitric oxide (NO) and nitrogen dioxide (NO2) — rather than nitrous oxide (N2O). Nitrous oxide (N2O) is the most potent greenhouse gas, rather than NOx.