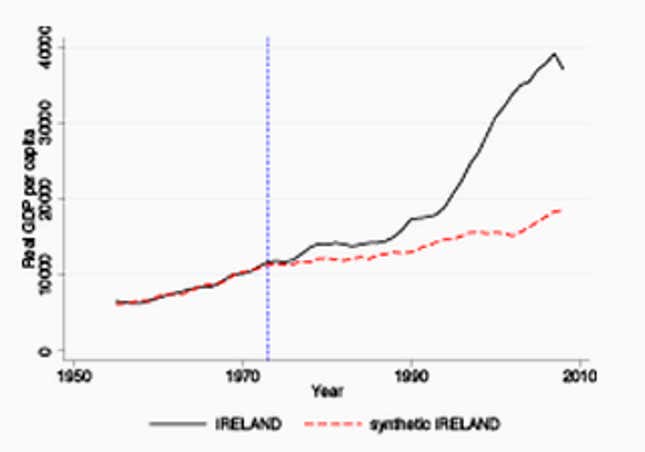
Start with Turkey, add roughly equal parts Argentina and New Zealand, mix in some Japan, add a dash of Mexico and you get… Ireland?
Fascinating new research from a trio of professors—Nauro Campos of Brunel University, Fabrizio Coricelli of the Paris School of Economics, and Luigi Moretti of the University of Padova—attempts to quantify the economic benefits of belonging to the European Union. Their method involves building “synthetic counterfactuals” for EU countries by combining different countries’ statistical trends in per capita GDP and labor productivity. The recipe above, amazingly enough, tracks the Irish economy very closely before it joined the EU in 1973 (see chart below).

By tracking how this synthetic non-EU Ireland performed in relation to the real thing inside the economic bloc, the researchers can gauge the costs and benefits of EU membership. As “euroskeptic” political parties gain ground across Europe, this is far from a purely intellectual exercise.
In the end, the professors found that incomes in the countries they studied were 12% higher, on average, as a result of joining the EU (and all countries benefited except Greece). They describe their results for the richer countries that joined the EU in 1973 and 1995 here and the poorer ones that joined in the 1980s and 2004 here.
What’s particularly interesting is the mind-bending logic behind the ingredients that the researchers used to build alternate-reality EU countries. Intuitively, it’s not too much of a stretch to imagine non-EU Britain as following a similar path to a country that’s 91% New Zealand and 9% Argentina. Non-EU Greece, on the other hand, is almost 50% Japan.
Here are the recipes the researchers use as proxies for per capita GDP in the 17 countries included in the study:*
- Austria: 57% Switzerland, 26% Australia, 17% Malaysia, 1% Chile
- Czech Republic: 63% Croatia, 18% Japan, 17% Iceland, 2% Uruguay
- Denmark: 86% New Zealand, 14% Japan
- Estonia: 88% Croatia, 7% Ukraine, 5% Malaysia, 1% Tunisia
- Finland: 41% Iceland, 31% Canada, 12% Brazil, 11% Tunisia, 4% Switzerland, 1% New Zealand, 0.2% Australia, 0.1% Uruguay
- Greece: 49% Japan, 28% Australia, 13% Brazil, 9% Tunisia
- Hungary: 53% Macedonia, 22% Mexico, 20% Iceland, 4% Egypt, 1% Hong Kong, 0.2% Uruguay
- Ireland: 29% Turkey, 26% Argentina, 24% New Zealand, 20% Japan, 1% Mexico
- Latvia: 66% Uruguay, 34% Egypt
- Lithuania: 51% Croatia, 42% Ukraine, 5% Hong Kong, 1% Canada, 0.5% Macedonia
- Poland: 61% Uruguay, 28% Egypt, 11% Australia
- Portugal: 34% Turkey, 19% Iceland, 14% Tunisia, 11% Uruguay, 10% Morocco, 8% Switzerland, 4% New Zealand
- Slovakia: 67% Croatia, 14% Malaysia, 13% Australia, 5% Brazil, 1% Hong Kong
- Slovenia: 46% Croatia, 19% Malaysia, 18% Canada, 16% Australia, 1% Hong Kong
- Spain: 52% Australia, 20% Argentina, 19% Brazil, 4% Mexico, 2% South Korea, 1% Japan, 1% Switzerland, 0.1% Morocco
- Sweden: 32% Canada, 27% Iceland, 19% Switzerland, 15% New Zealand, 7% Chile
- United Kingdom: 91% New Zealand, 9% Argentina
* Totals may not add up to 100%, due to rounding
