The four economic charts of the day you really need to see
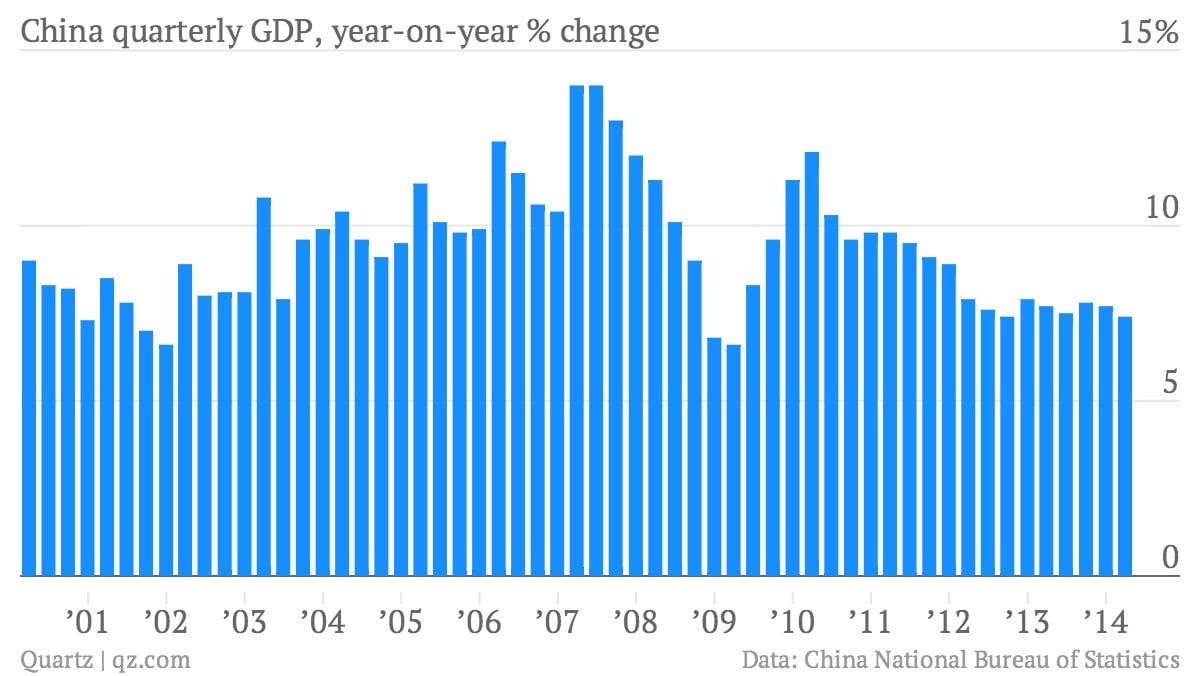
Economic output hit 7.4% year-on-year in the first quarter. That’s the slowest rate since the third quarter of 2012. But Chinese stocks rallied on expectations the government would respond to the slow growth by pumping in more stimulus.
And even more amazing, real wages kept pace with inflation in the UK. It remains to be seen whether signs of pep in the British economy will be enough to keep David Cameron’s Conservative-led coalition in power.
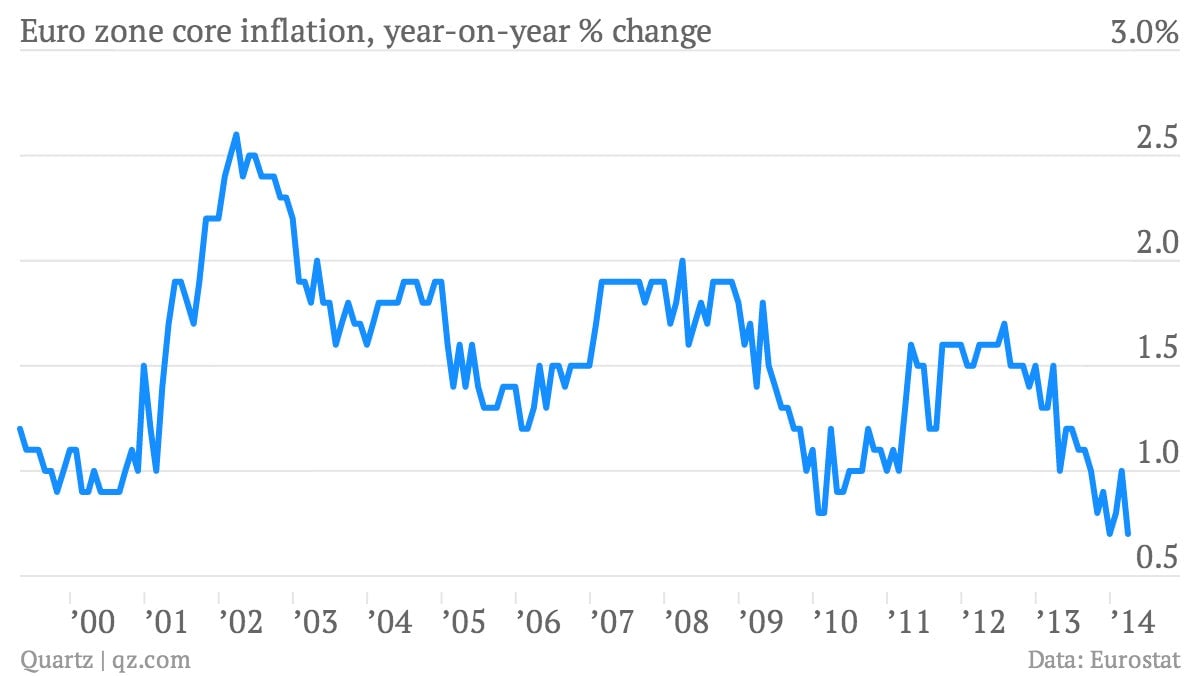
3. Europe continues courting deflation
A second look at core inflation—price rises excluding noisy categories like food, energy, tobacco and alcohol—showed euro zone price increases were even softer than first thought in March. Core euro-zone inflation was 0.7% during the month, compared to the prior year. It was 1.0% in February. Deflation—an economically debilitating, widespread decrease in prices—seems a real risk.
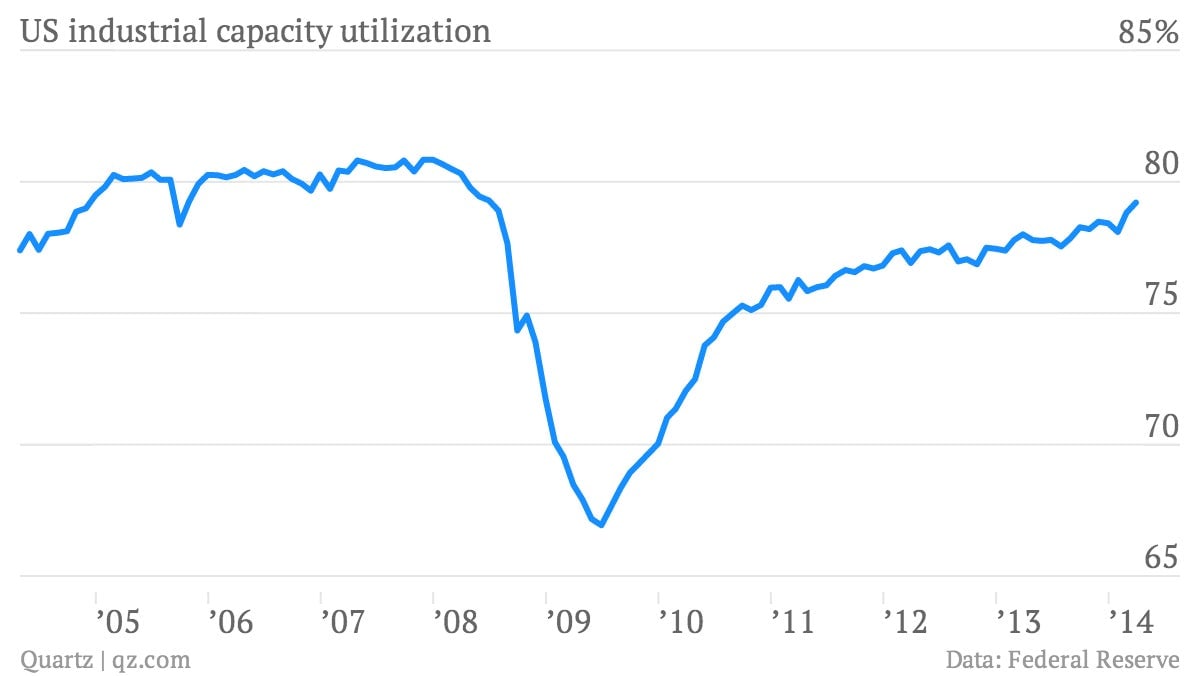
4. US capacity utilization hits post-crisis high
Low capacity utilization is traditionally seen as an indicator that companies can put more of their people and equipment to work without setting off an inflationary spiral of wages and prices. In normal times, especially high utilization rates could put pressure on the Federal Reserve to raise interest rates. But in a speech today, Fed chair Janet Yellen emphasized that she remains more concerned about economic slack and persistently low inflation, rather than the risk of rising prices, which suggests interest rates will stay low for a while longer.