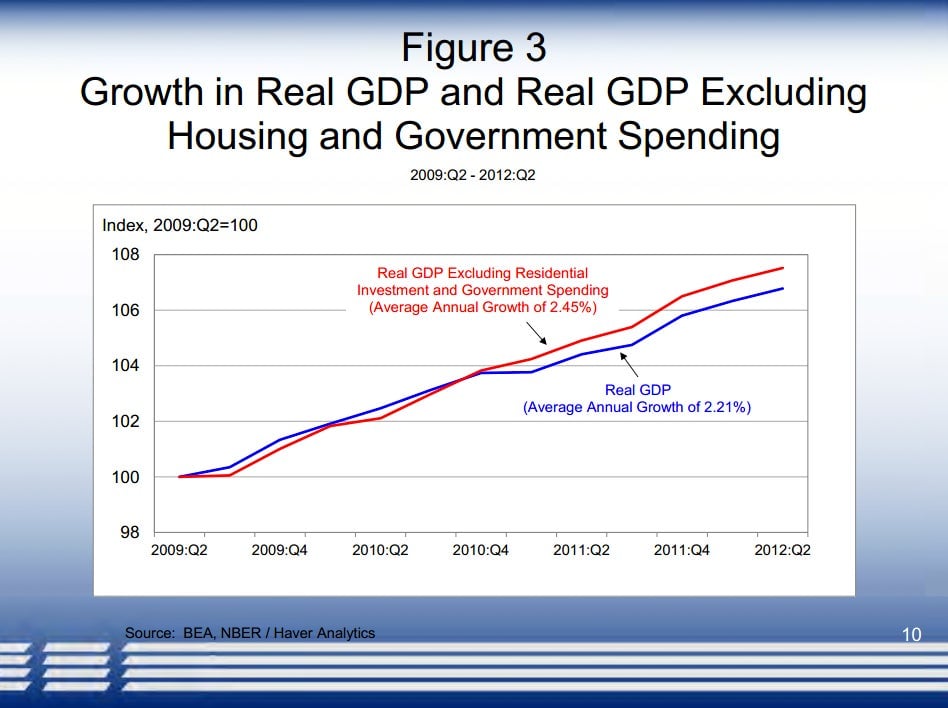
For a while, critics of the US government’s response to the Great Recession have noted that the US has been running something of a shadow austerity policy in recent years. For instance check out this chart from Boston Fed President Eric Rosengren from a speech he made back in September. Pointing to the chart, Rosengren argued that drags from government spending and housing were two of the root causes of sluggish economic output in the US.
For a while, critics of the US government’s response to the Great Recession have noted that the US has been running something of a shadow austerity policy in recent years. For instance check out this chart from Boston Fed President Eric Rosengren from a speech he made back in September. Pointing to the chart, Rosengren argued that drags from government spending and housing were two of the root causes of sluggish economic output in the US.
Figure 3 shows, and compares, the growth rates of real GDP and real GDP excluding residential investment (housing) and government spending. As the chart shows, there is a notable difference in the growth rates. While real GDP has grown only by 2.21 percent, real GDP excluding housing and government spending grew by 2.45 percent. Had the economy not had the headwinds from government and housing dragging growth lower—had it grown just by that higher rate of 2.45 percent over the three years of the recovery—outcomes would be somewhat better. However, normally a sector like housing would be expected to grow much more quickly than other sectors of the economy in the early stages of a recovery—given housing’s interest-rate sensitivity—and thus we would expect it to provide more impetus to overall economic growth.
Join 500,000+ readers who start their day with Quartz.
By subscribing, you agree to our Terms of Service and Privacy Policy.
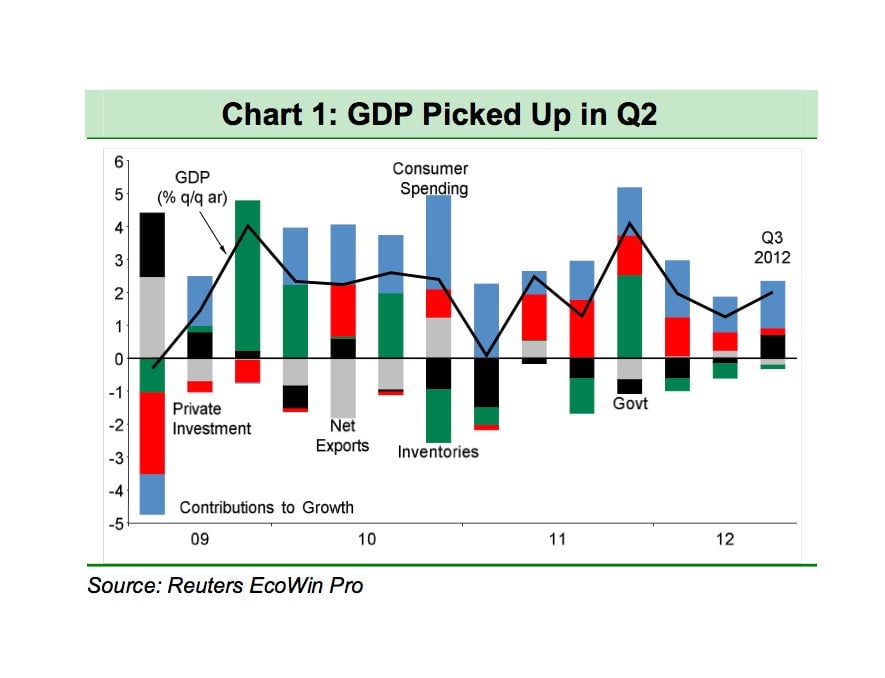
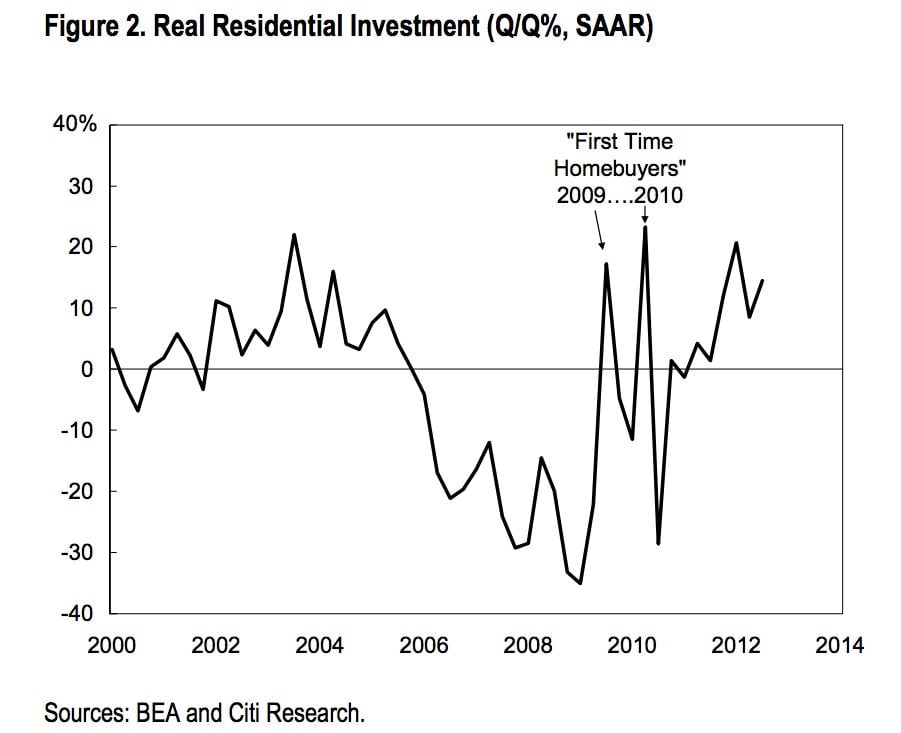
And judging from these just-published charts from the Julia Coronado and her team at BNP Paribas, it looks government spending kicked into gear during the third quarter, thanks to Federal defense spending which rose 13%. The black component of the bar is government spending. And housing activity, we know, has been picking up. That’s due in part to the Federal Reserve’s latest policy of creating money and using it to buy mortgage-backed securities and keep mortgage rates low. Housing investment jumped a massive 14.4% during the third quarter. Here’s a chart from Citigroup $C economics.
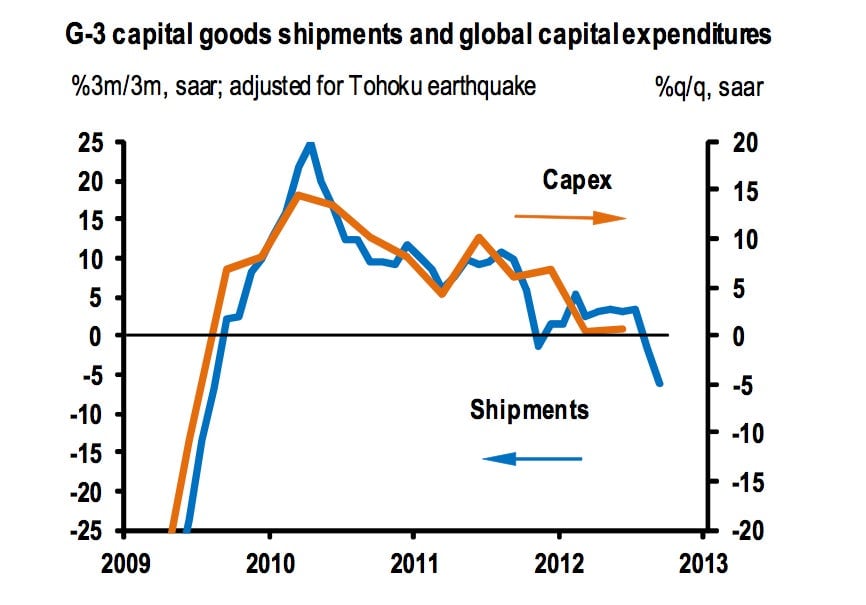
The weak link in the chain seems to be business spending. With a slew of corporate chieftains citing the looming fiscal cliff as cause for concern, we’ve seen numbers on business spending looking really anemic lately. That dynamic has been reinforced by the ongoing uncertainty in Europe and the slowdown afoot in China. As a result companies are likely to keep cutting back capital expenditures in other large economies too. This chart, from JP Morgan economics, shows the trends for shipments and capex in Germany, the US and Japan.