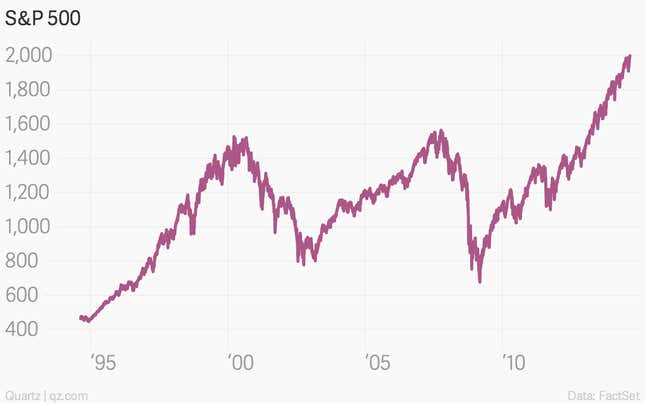
Think back to March 2009. The US economy smoldered quietly in a ditch. The rickety financial system was tottering. Corporations puked hundreds of thousands of pink slips each month. The benchmark S&P 500 hit an ominously low level of 666.79 on March 6, before scraping a closing low of 676.53 on March 9, not seen in more than a decade. It had collapsed by 57% from its October 2007 high, inflicting more than $9 trillion in paper losses.
From the perspective of a stock watcher, all that unpleasantness now looks like a very bad dream. That very same S&P 500 stock index just touched the never-before-reached level of 2,000 in intraday trading. The high tick of 2000.27, just before 10:15 a.m. ET is the culmination of a rally that has nearly tripled the value of the S&P off its March 2009 low.

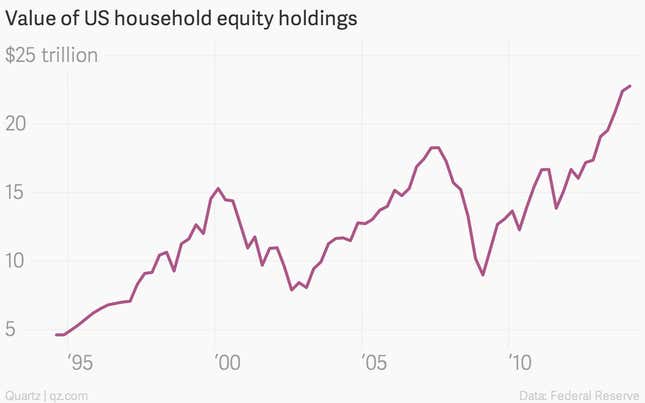
On the one hand, such a rip-roaring recovery in the stock market shouldn’t be taken shouldn’t be scoffed at. The Dow Jones Industrial Average didn’t recover all the losses it suffered in the great crash of 1929 until the mid-1950s. Japan’s Nikkei remains roughly 60% below its all-time peak set in early 1990, before a real estate and banking bust sent it reeling. It’s clear that the recovery in US stocks has done much to repair the aggregate balance sheets of the American household sector.

But that’s only true from an aggregate perspective. For one thing, the Federal Reserve’s definition of “household” sector includes things like hedge funds—investment vehicles of the wealthy—in addition to just things mutual fund holdings from working stiffs.
And besides that, a rising stock market disproportionately benefits the country’s most-affluent households. While roughly 49% of all American families have some sort of stock investments—either directly or indirectly through mutual funds—most of those holdings are fairly piddling. ”The faster recovery of financial assets mainly has benefited wealthier families, who own most of the economy’s stocks and other financial assets,” wrote analyst from the Federal Reserve of St. Louis in a report on the recovery of American households.
In other words, the S&P 500 isn’t going to tell you much about the living standards of average Americans. To get a better handle on that we can look at statistics like personal income per capita, adjusted for inflation, otherwise known as “real” wages. The short version? It’s essentially stalled. Real per-capita disposable income sat at $37,226 at the end of May, up a scant 1.2% compared to the prior year. Since 2009, it’s up just 4.7%. (Between 1980 and 2007, it grew at an annual average of 2.1%.) By comparison, the S&P has risen more than 190% since it bottomed in 2009. (And that doesn’t even count corporate payouts to shareholders in the form of dividends.)
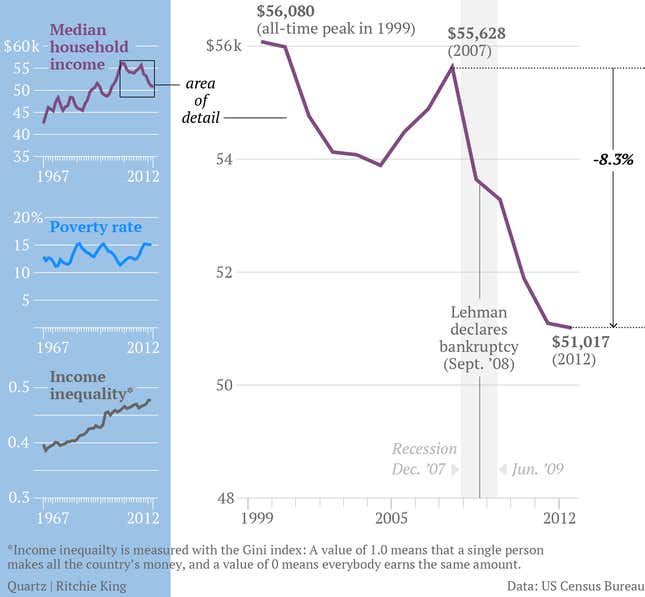
Other measures of living standards tell a similar story. For example, the most recent data we have on median household income are from 2012, but showed that households incomes were still 8.7% below their 2007 peak. (Though an update on that official data, due next month, should show at least some improvement.)

So it’s no wonder you don’t see people dancing in the streets for S&P 2,000.
Now, does that mean that the stock market is irrelevant? Of course not. Rising stock markets, in general, are a good thing for consumer sentiment, which can be a boon to the economy. And that’s one of the reasons that the Fed has worked so hard to try to prop up the prices of financial assets such as stocks. But when it comes to actually improving the lot of your average American, look to real (i.e., inflation adjusted) wages, not the stock market.
