Never mind the 2.3% drop this past month in the S&P 500 Index. Investors are excessively blasé right now, and that could be dangerous.
That’s the conclusion of the private financial-sector representatives who advise the US Treasury Department on technical debt-management issues. The group, known as the Treasury Borrowing Advisory Committee (TBAC), made its argument (pdf) as part of its quarterly meeting with the government, in which it usually makes a presentation on a specific area of market activity.
The committee’s report warns that investors might be unprepared for the possibility that markets get increasingly choppy as the Federal Reserve moves away from the support it’s been offering the economy.
“Implied volatility” tells us how uncertain market investors are about future movements of stocks, bonds, currencies and other financial assets. And right now, it seems nobody is expecting a roller coaster ride. We’re approaching levels of implied volatility last seen in late 2012, before the “Taper Tantrum.” In the past two decades, there has been only one other time when the reading was that low, and that was in the period just before the financial crisis hit.
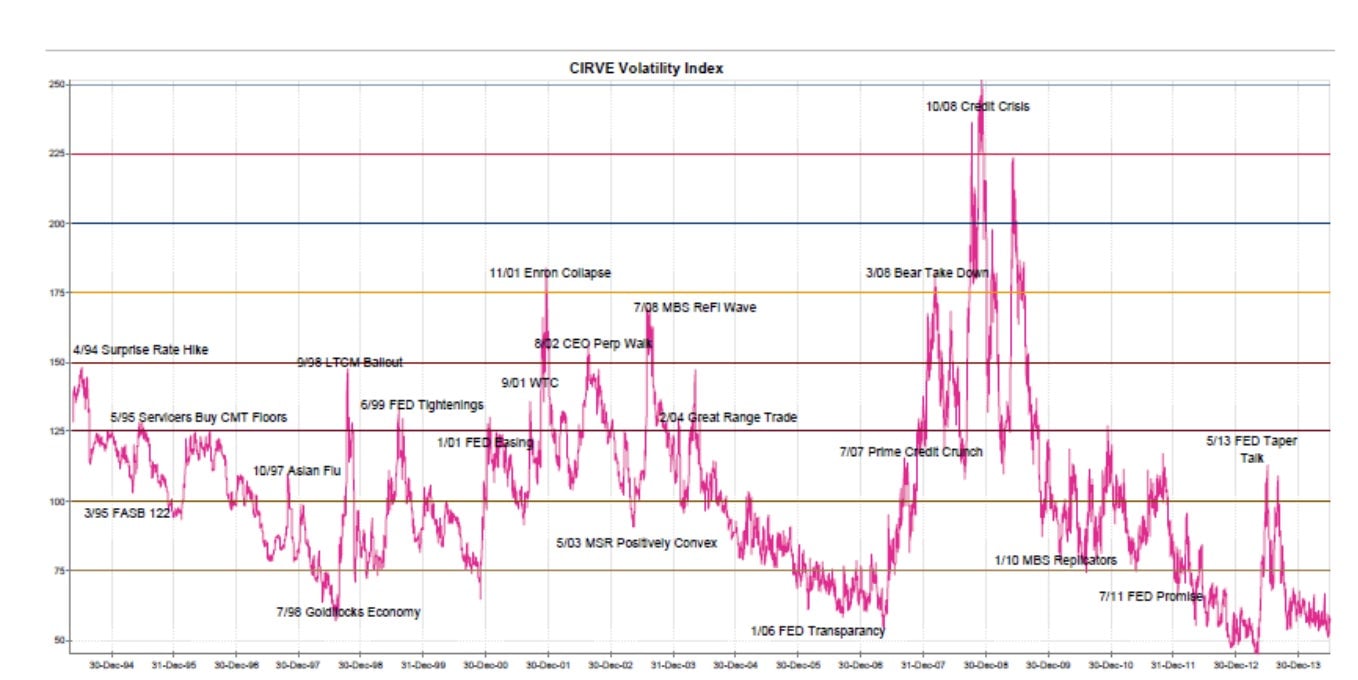
Here’s a look at the Credit Suisse Interest Rate Volatility Estimate, or CIRVE, which tries to gauge what kind of price swings the investors expect in the market for government bonds. Expectations for market excitement are about as low as we’ve ever seen.
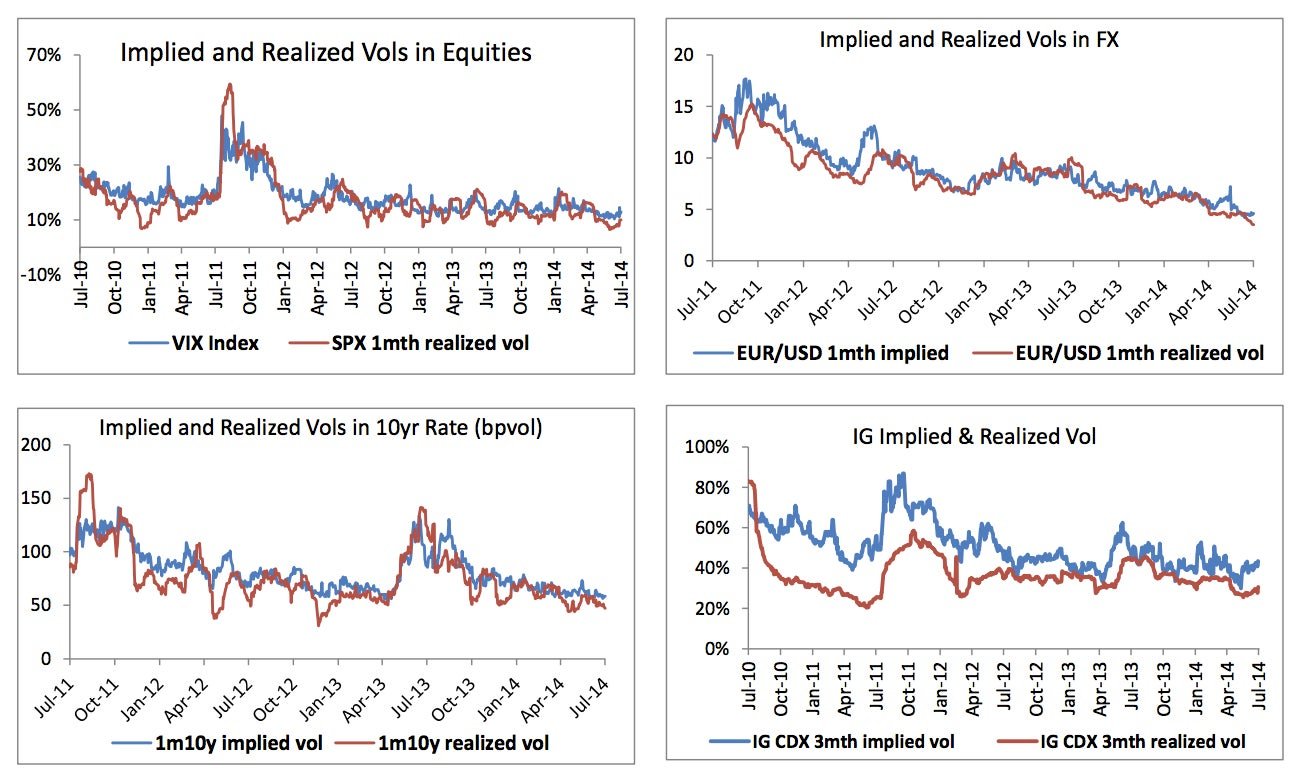
Across asset classes, realized volatility—that’s a backward-looking reading of how much asset prices actually moved up or down—has been extremely low. This could be a problem because realized volatility is baked into the formulas used to calculate implied volatility. ”Realized volatility is extremely low, which leads to lower implied volatility in a self-reinforcing loop,” wrote analysts in the TBAC report.
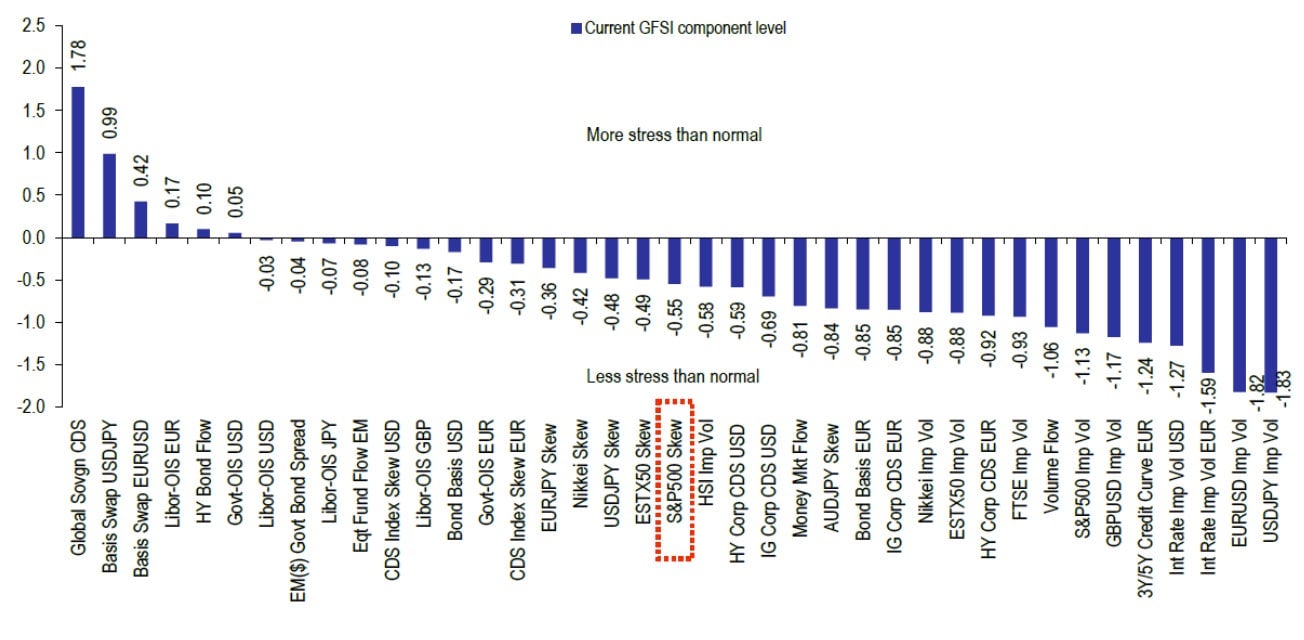
The Global Financial Stress Index (GFSI) from Bank of America $BAC Merrill Lynch attempts to measure global risk appetite by using a range of different indicators, including implied volatility readings, money flows into different asset classes, and prices for derivatives that pay out in the case of default. Of the 39 indicators included in the TBAC report presented on Aug. 5, 33 showed less stress than normal.
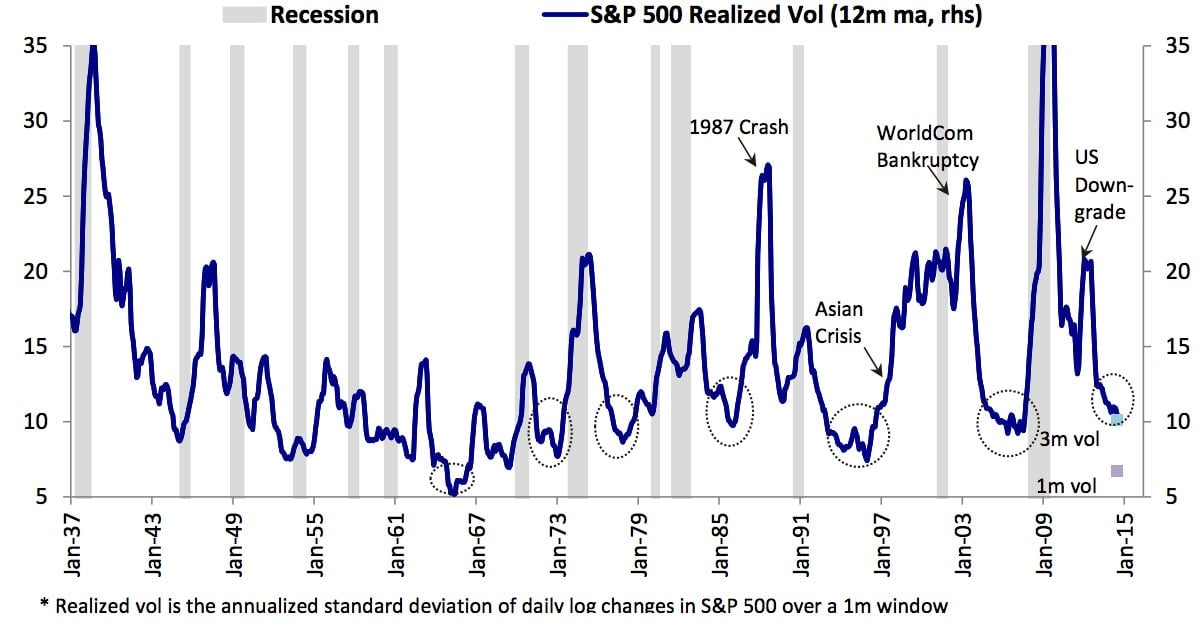
Realized volatility—the actual zig-zagging of the market—tends to follow the business cycle. For instance, price movements in US stocks (the chart below looks at volatility for the S&P 500) surge around recessions, slow during recoveries and tend to bottom out before the next economic pothole. At some point the markets will get choppy again; we just don’t know when.
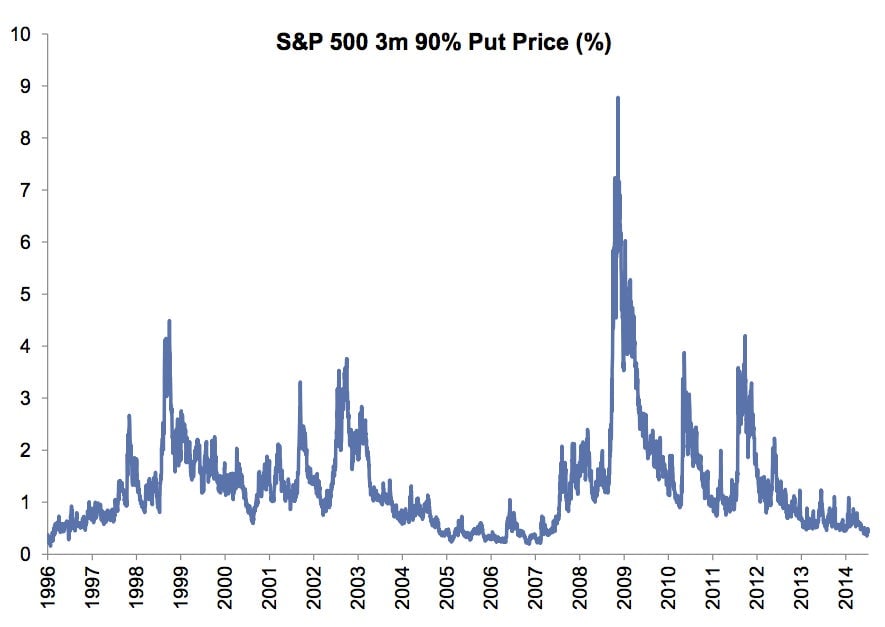
Fewer people in the markets are hedging against the risk of a big market shock. Here’s the TBAC chart that shows the price of betting on a big drop in the US stock market. People don’t seem too worried right now, so insurance is cheap.
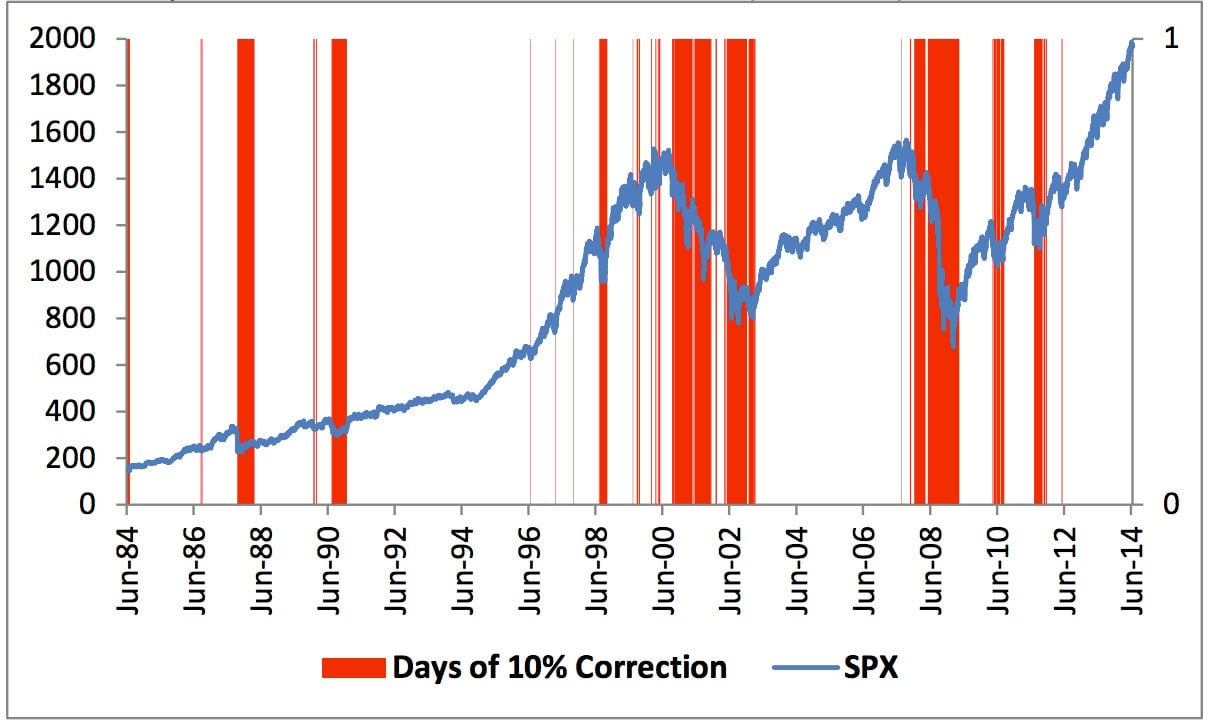
If recent history is any guide, there’s reason to worry. This chart shows the declines of 10% or more for the S&P 500. A 10% decline is commonly called a “correction.” We haven’t had one of the cooling-off periods in quite some time. And the further we pull away from the last correction, the closer we’re moving to the next one.