The most important charts to see before the massive August jobs report
All indications are that this Friday’s US jobs report for August is going to be a very, very big one.

All indications are that this Friday’s US jobs report for August is going to be a very, very big one.
The most recent consensus forecast shows that Wall Street economists expect that 220,000 jobs were created in August. (The unemployment rate is expected to hold steady at 6.1%.)
Here’s why everyone seems so optimistic.
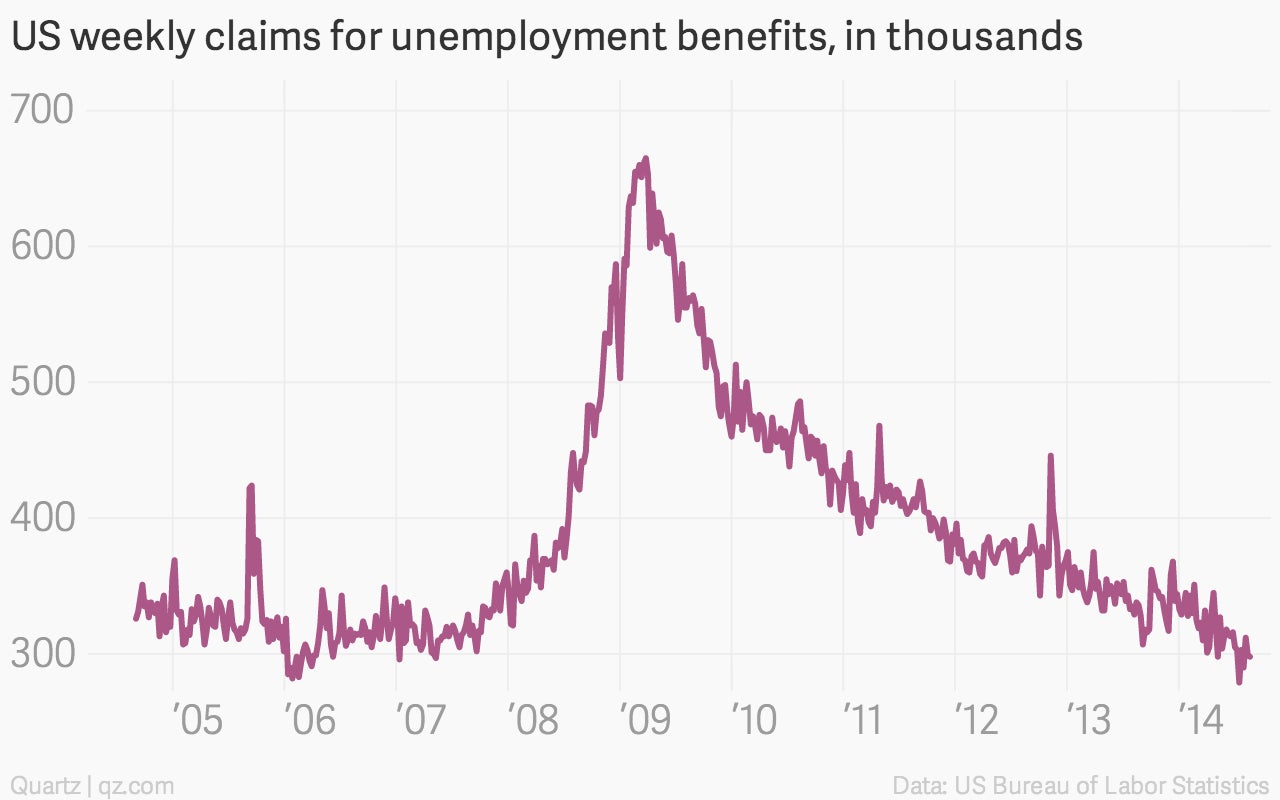
Initial jobless claims
During the week in which much of the survey work used to produce the jobs report was done, weekly claims for unemployment benefits remained at some of the lowest levels seen in recent years, roughly 299,000. That’s a good sign. Ted Wieseman, an economic analyst at Morgan Stanley $MS, recently wrote that the ongoing strength in jobless claims through August “is quite impressive, enough so for us to marginally nudge up our August payrolls forecast to 250,000 from 240,000.”
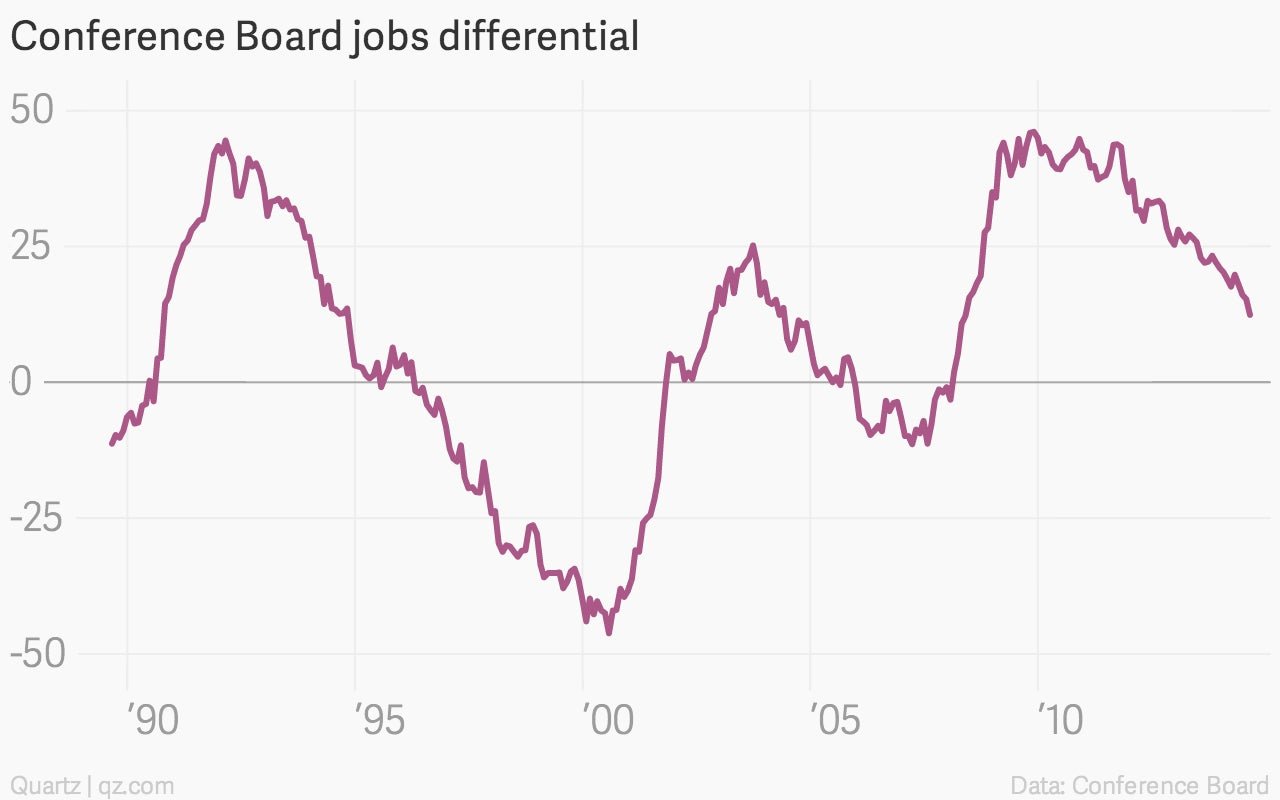
Jobs differential
Each month we spotlight the so-called “jobs differential,” an indicator that’s buried in the Conference Board’s monthly update on US consumer confidence. The jobs differential is basically the difference between the number of people who said jobs were “hard to get” and those who said jobs were “plentiful” in the the non-profit research group’s monthly consumer sentiment survey. And in recent months, it has been falling fast—a good sign.
In August, it fell to 12.4, a new post-crisis low, from 15.3 in July. This is an indication that job creation has been so robust that regular Americans are starting to notice. Essentially, Americans now feel jobs are about as hard to get as they were during early 2004, when the US economy was really starting to gain traction after the recession of the early 2000s.
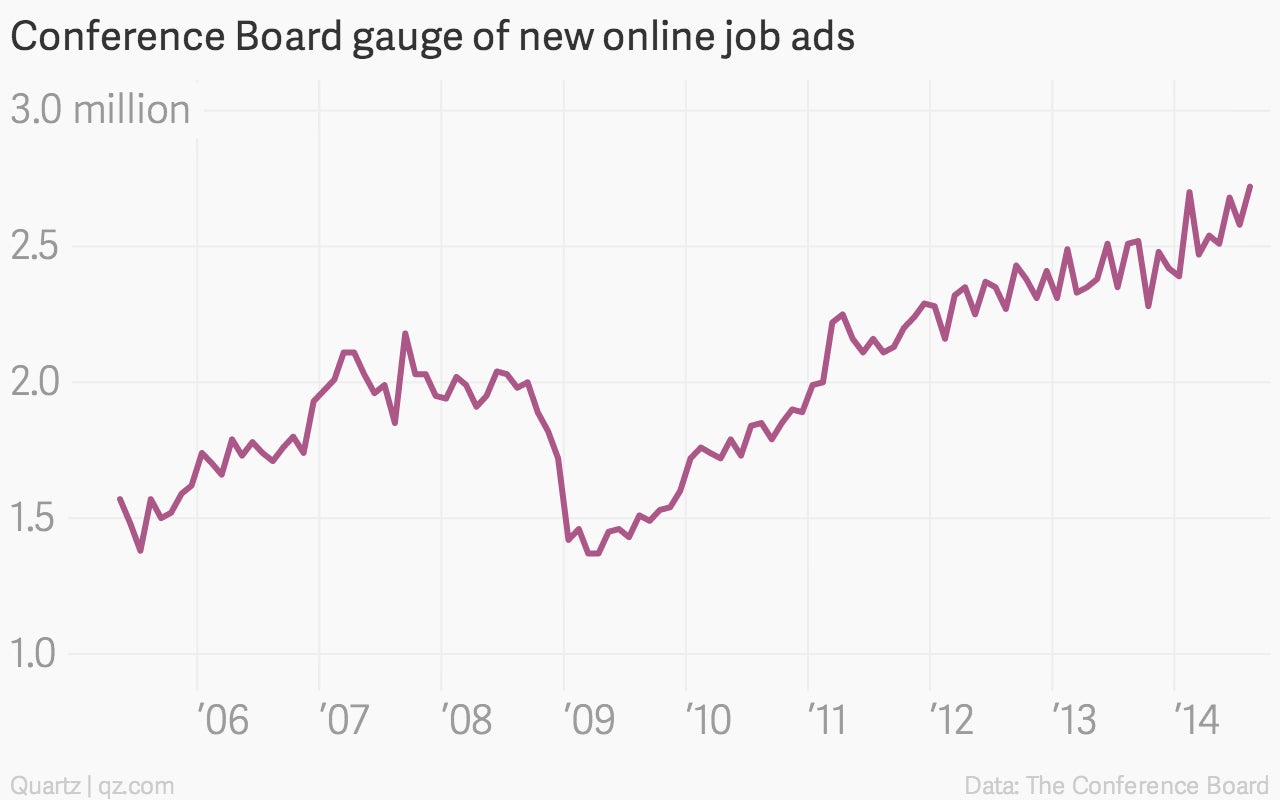
Companies are looking to hire
The private research group known as the Conference Board has seen a fresh surge in its tally of new online job advertisements in August, when rose to more than 2.7 million. That’s a good sign of increased labor demand.
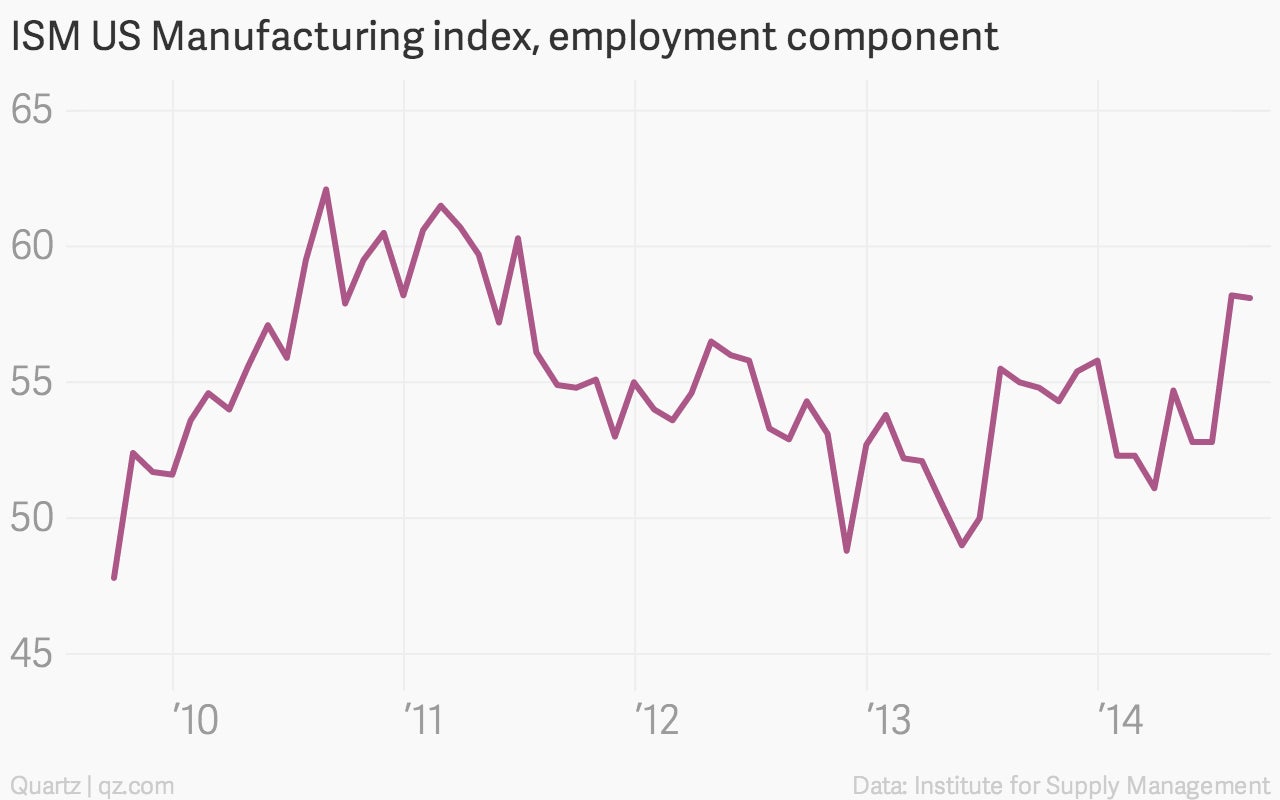
Manufacturing continues to ramp up
The ISM gauge of factory employment stayed above 50, the line that separates expansion from contraction. That indicates ongoing job growth in the cyclical industrial sector, which is watched as proxy for the broader economy.
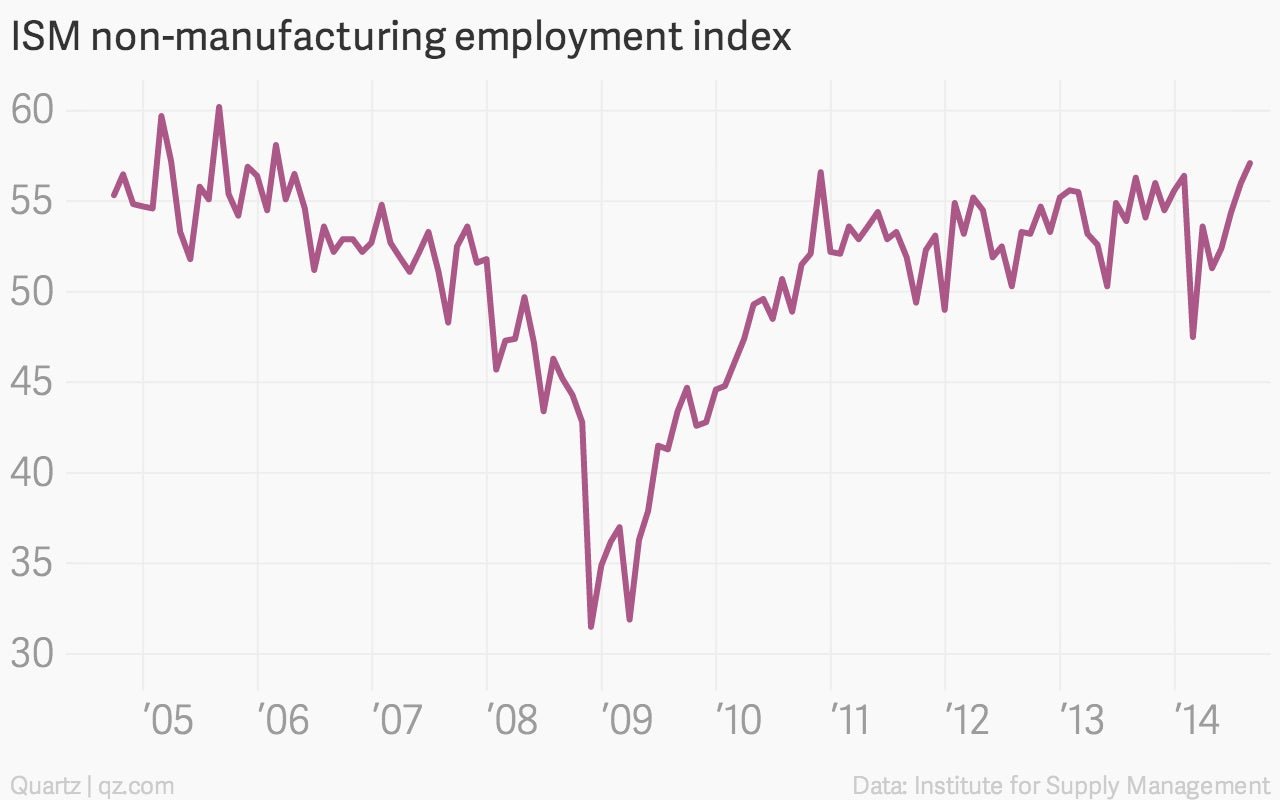
Soaring services
Meanwhile, the ISM’s gauge of the non-manufacturing sector is surging too. The employment index from that report notched a post-crisis high in August. This is an especially big deal, as there are far more jobs in services in the US than there are in manufacturing.
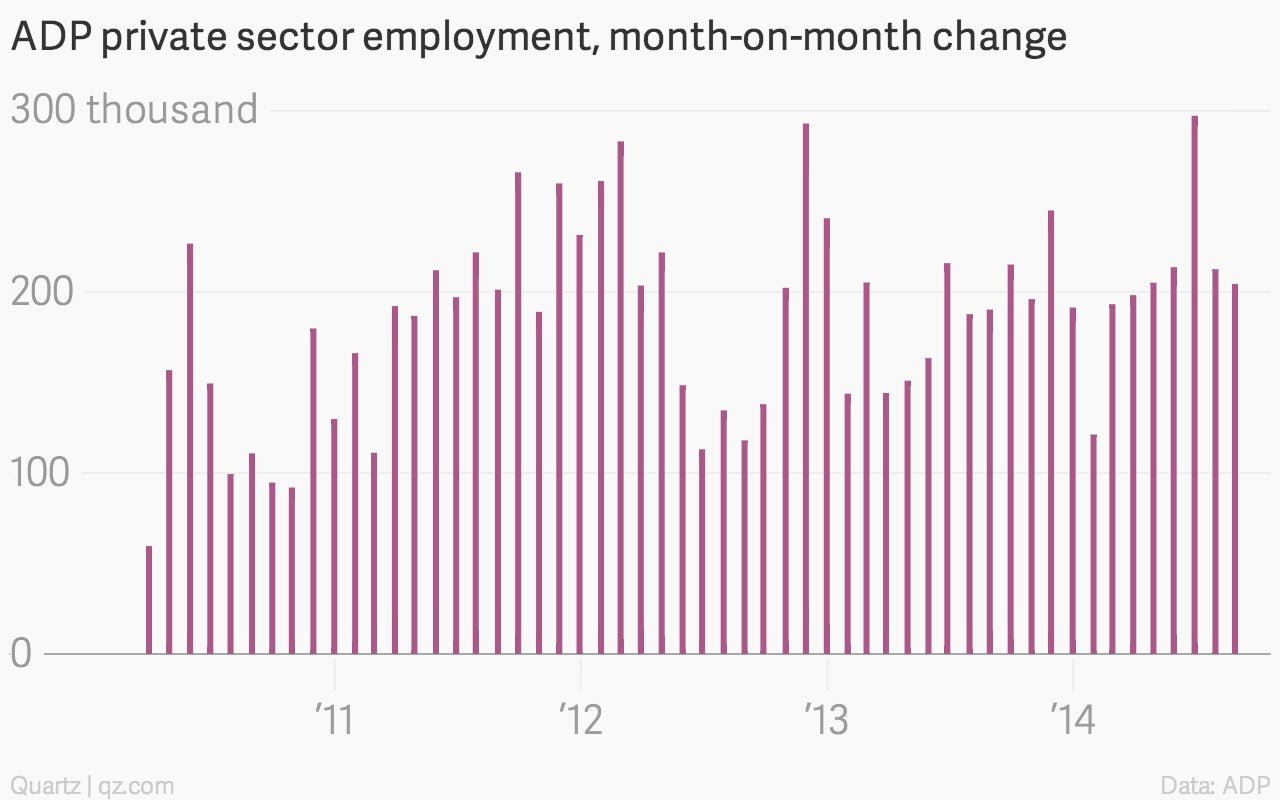
Private sector stability
Paycheck processor ADP’s gauge of private sector employment did slip slightly in August. But it’s hard to see that as real information, given how the report has a long history of being out of step with the official government numbers. Still, if you’re looking for a grain of salt to take about the strength of the labor markets, this could be it.
The essential business news, delivered fresh every morning.
Join 500,000+ readers who start their day with Quartz.
By subscribing, you agree to our Terms of Service and Privacy Policy.