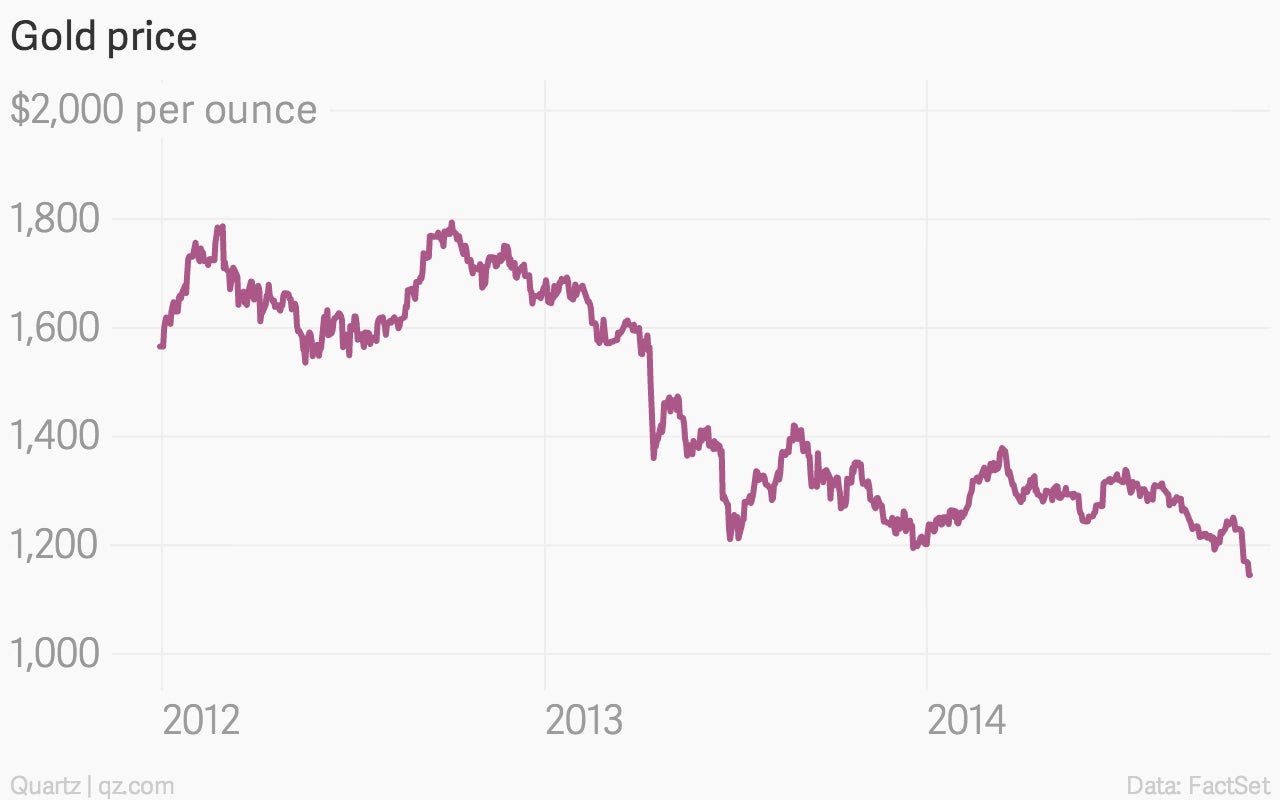
Gold bugs are getting squashed. The precious metal has lost 15% of its value from the highs set earlier this year, with a particularly steep fall in recent weeks.
Buying gold has been a losing bet for a while, but some analysts see a rout around the corner. Trading at around $1,145 per ounce at the time of writing, ABN Amro reckons the yellow stuff could sink to $800 per ounce next year.
Gold is considered by some as a hedge against extreme events—hyperinflation, depression, stock market crashes, currency collapses, you name it. Although the metal is widely held and traded, the gold market attracts more than its fair share of conspiracy theorists who push the case for gold by always seeing disaster around the corner.
Technical analysis of the gold price is particularly fraught, given its limited practical use and lack of dividends, interest, rent, or any other sort of income.
And that’s what produces satirical send-ups of chart-based research of the gold price—behold the dreaded “vomiting camel” pattern:
The current case for selling gold is based on (slightly) more serious trends, namely the biggest gap between the gold and silver price in five years. This is a bearish signal, some analysts say:
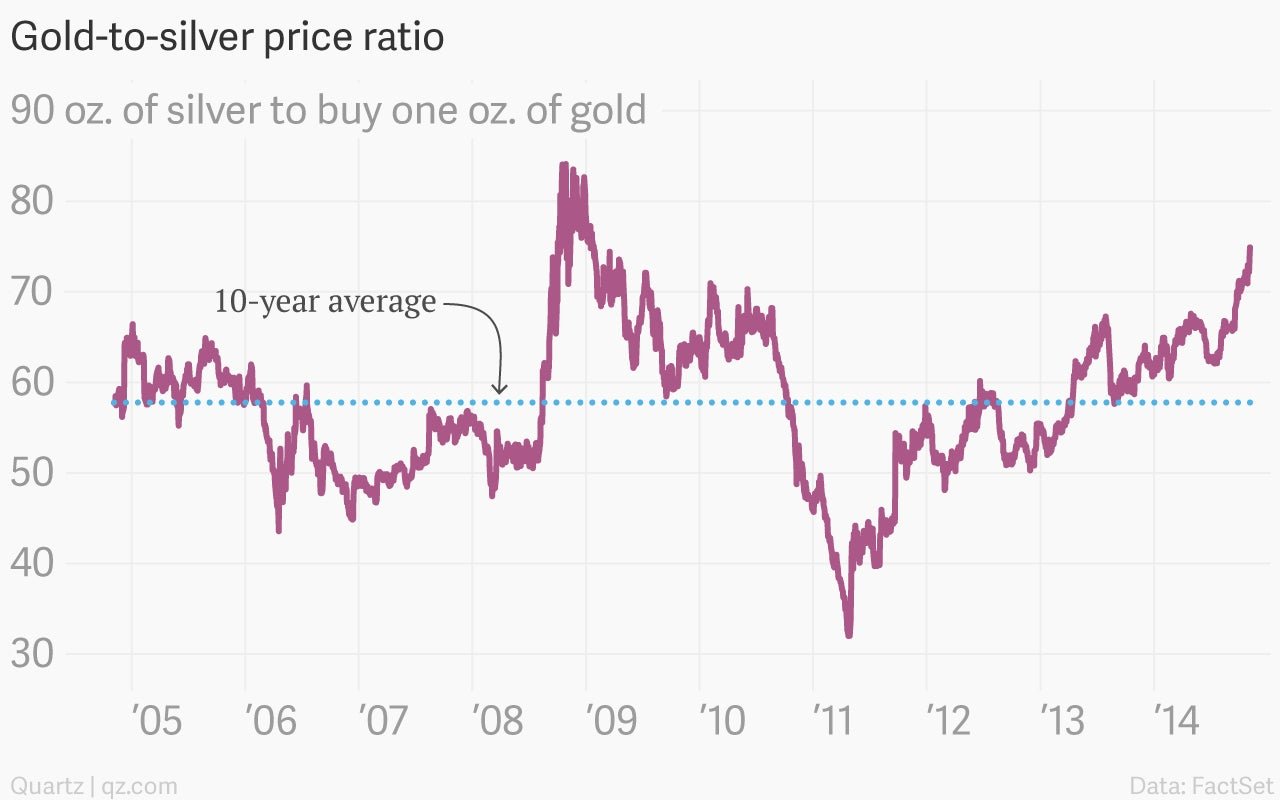
Then again, as Bloomberg notes, “the measure may not be useful as an indicator for gold’s outlook.”
But while we’re at it, why limit our analysis of gold to comparing it to other metals? Gold is also looking a bit pricey when compared to crude oil, Bloomberg says:
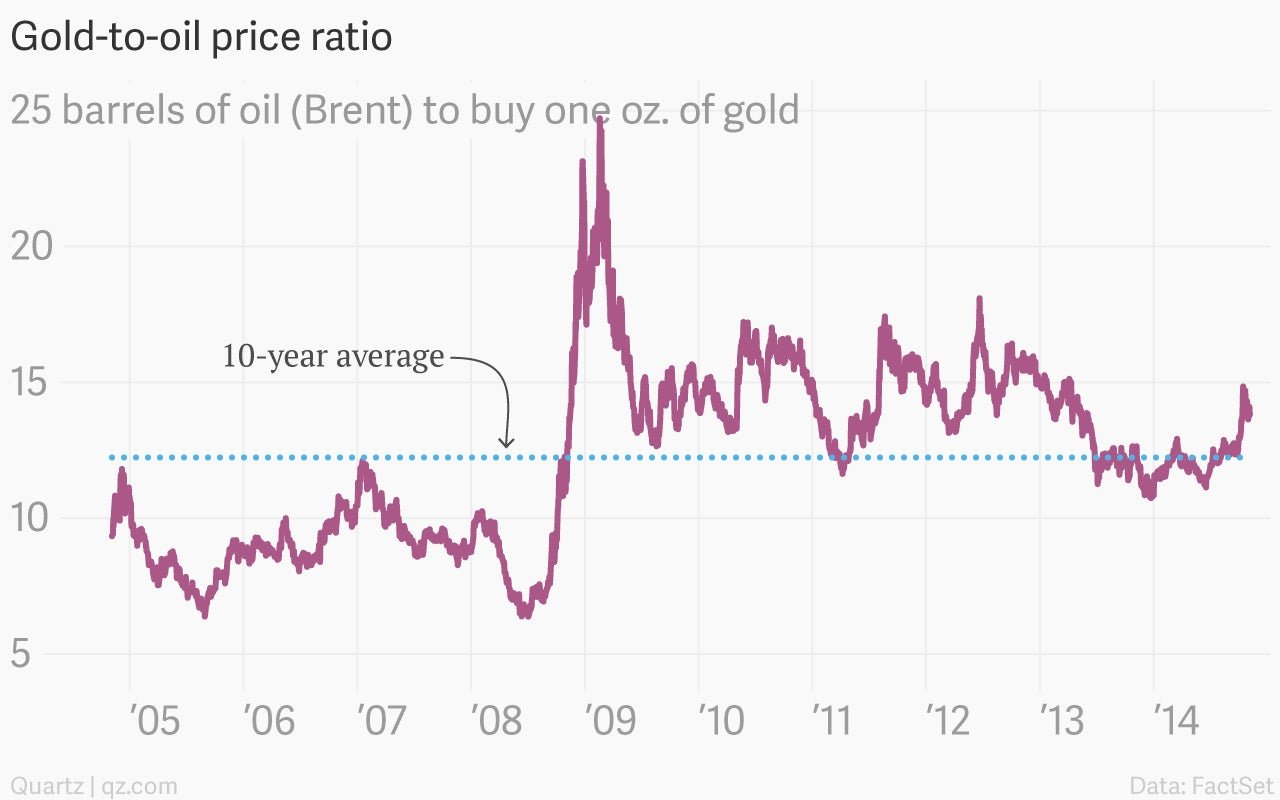
For your chart-based edification, here are five more charts with the signals that various markets are sending—or not—about the price gold. Interpret at your own risk.
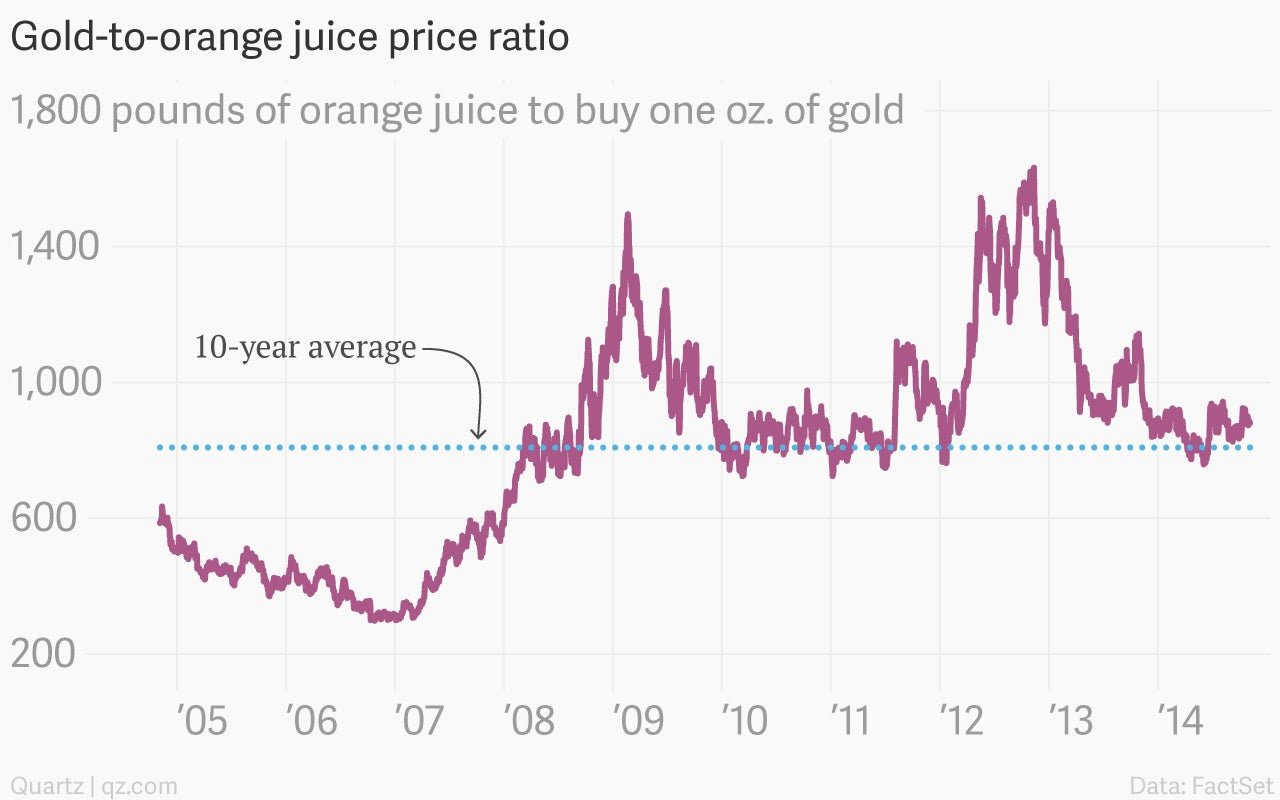
Bearish: Gold is trading a bit above its long-term average ratio to orange juice prices, which have been suffering from low demand of late:
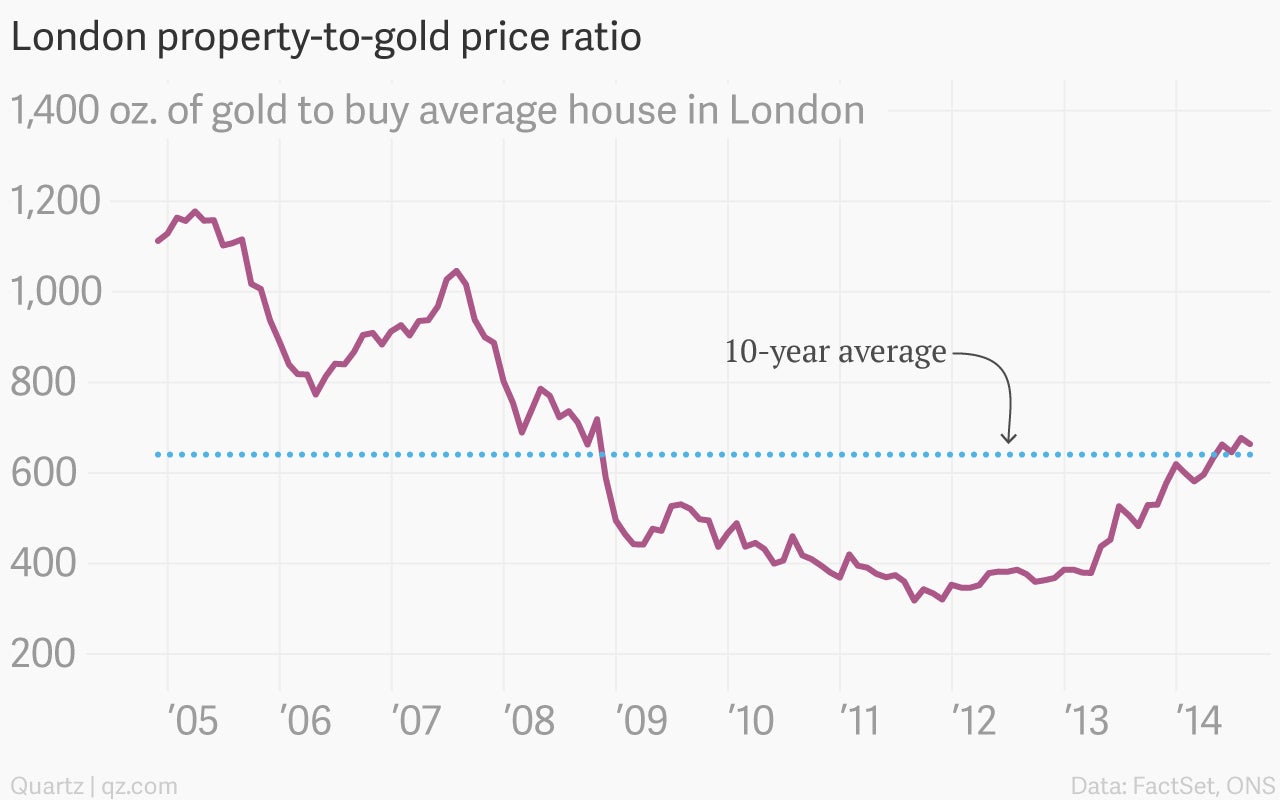
Neutral: It takes about as much gold—640 ounces, to be exact—to buy the average house in London today, about the same as the 10-year average:
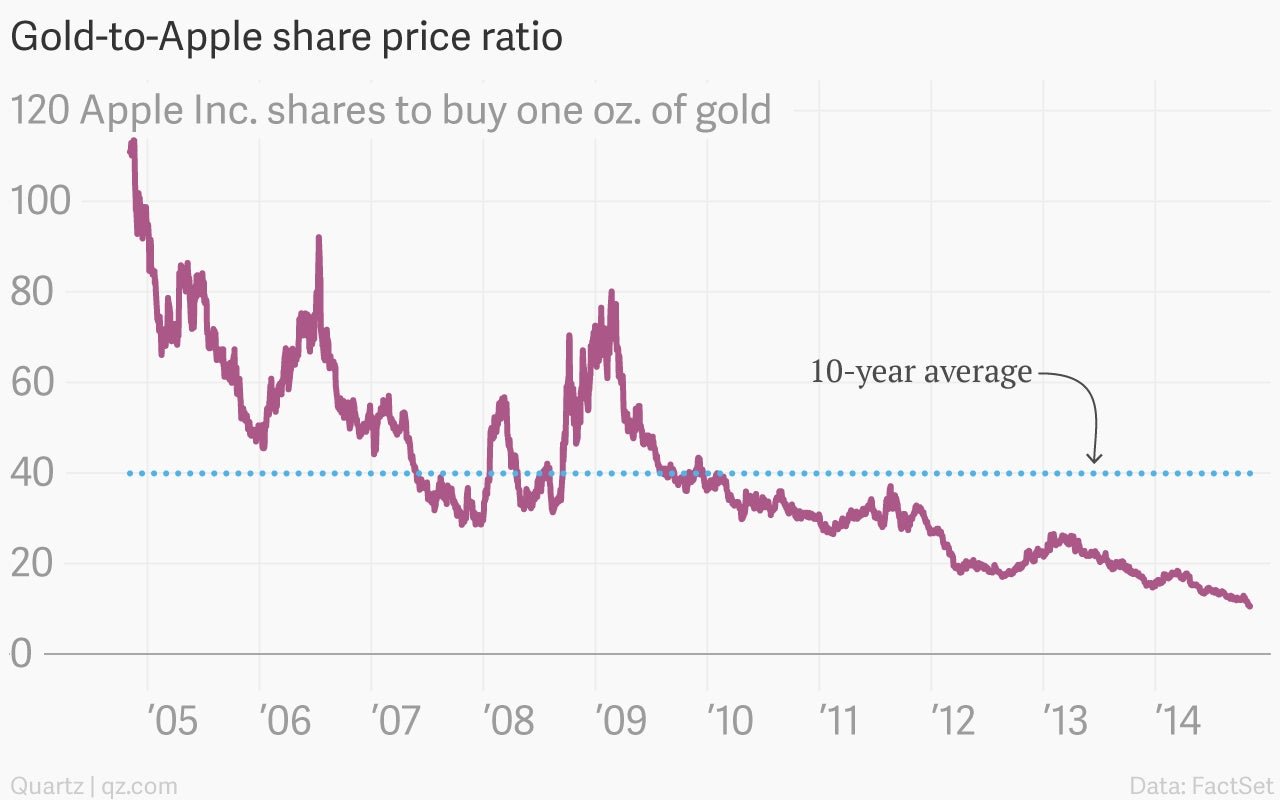
Bullish: Relative to Apple $AAPL’s high-flying shares, gold looks like quite a bargain:
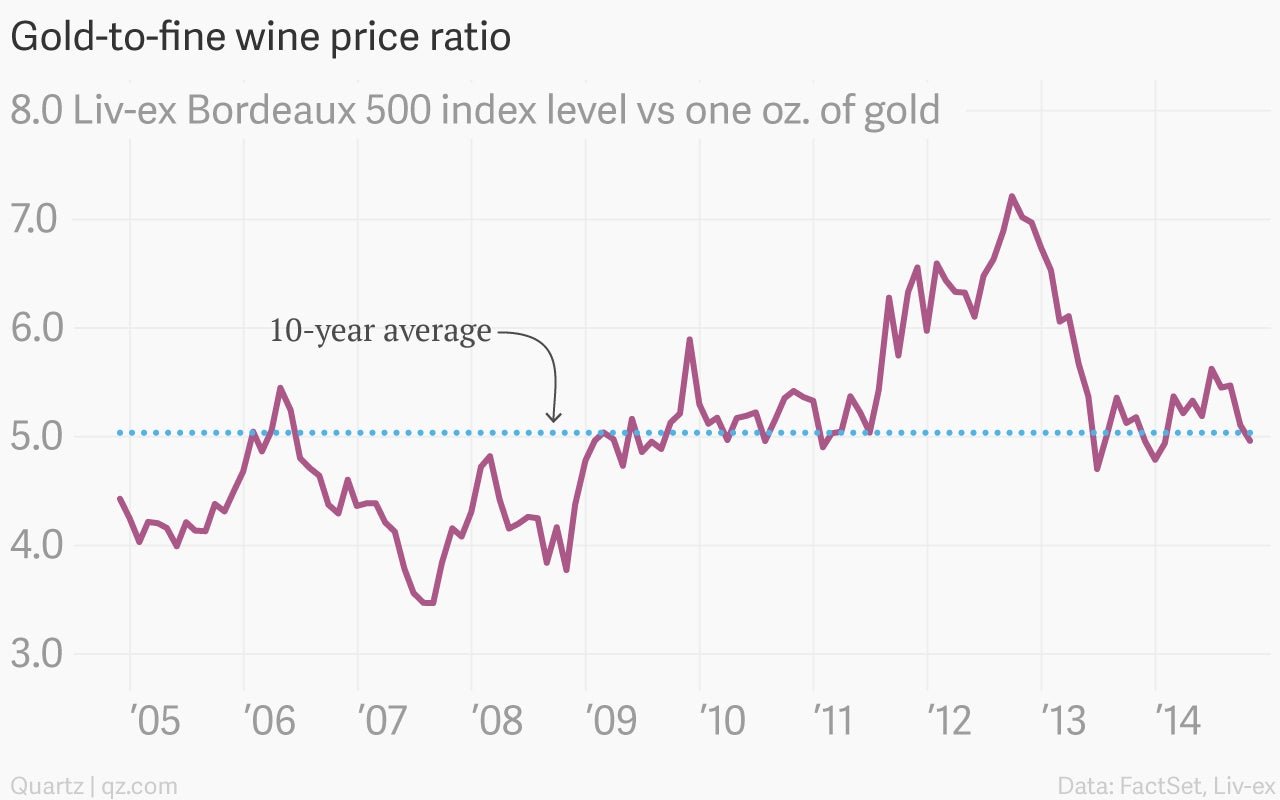
Neutral: Gold is roughly in line with historical trends for fine-wine prices, as measured by an index of 500 leading vintages tracked by Liv-ex:
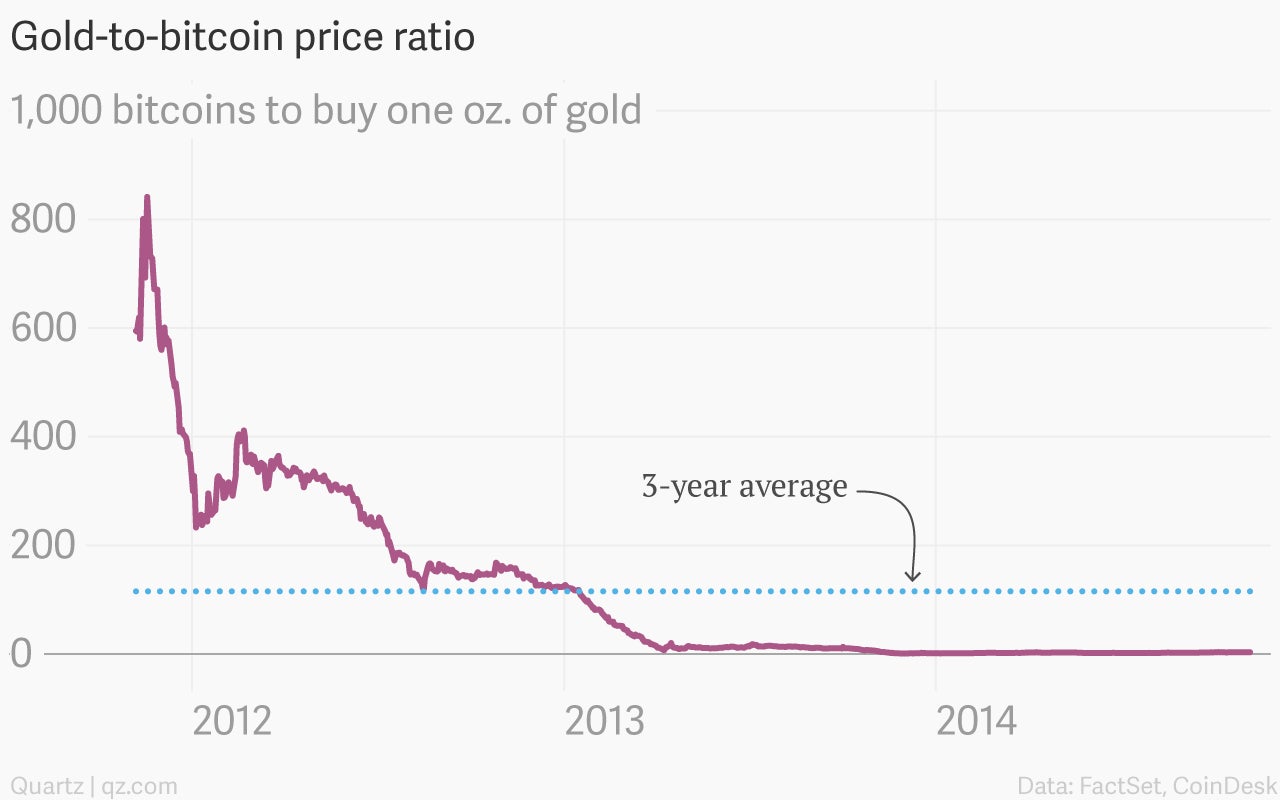
Bullish: Gold looks undervalued compared to bitcoins, although a distinct lack of history and brutal volatility of the cyptocurrency makes it hard to read too much into this (or anything else above, really). Trade with care!