Oil’s falling, the US is balling and the rest of the world’s economies seem to be crawling this week.

Oil’s falling, the US is balling and the rest of the world’s economies seem to be crawling this week.
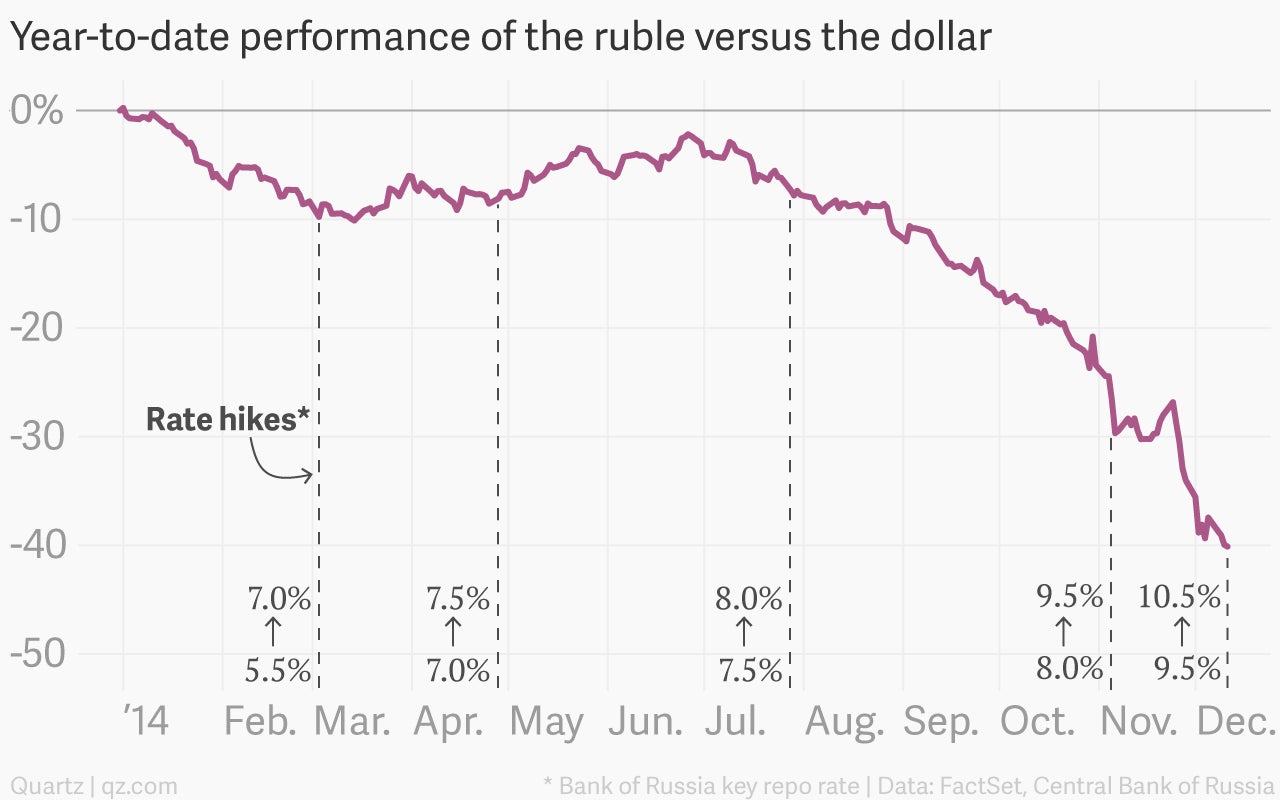
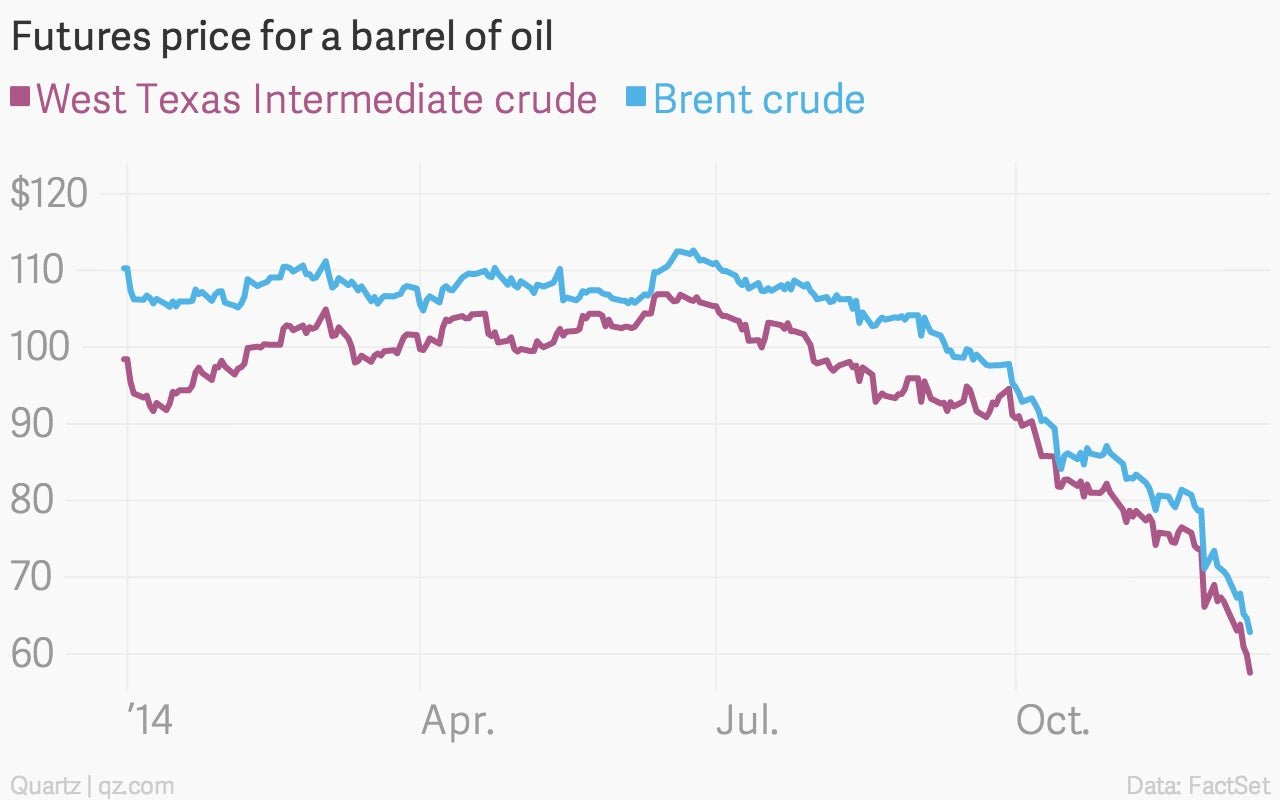
Yes, they’re still falling. Both are down more than 40% for the year.
Join 500,000+ readers who start their day with Quartz.
By subscribing, you agree to our Terms of Service and Privacy Policy.
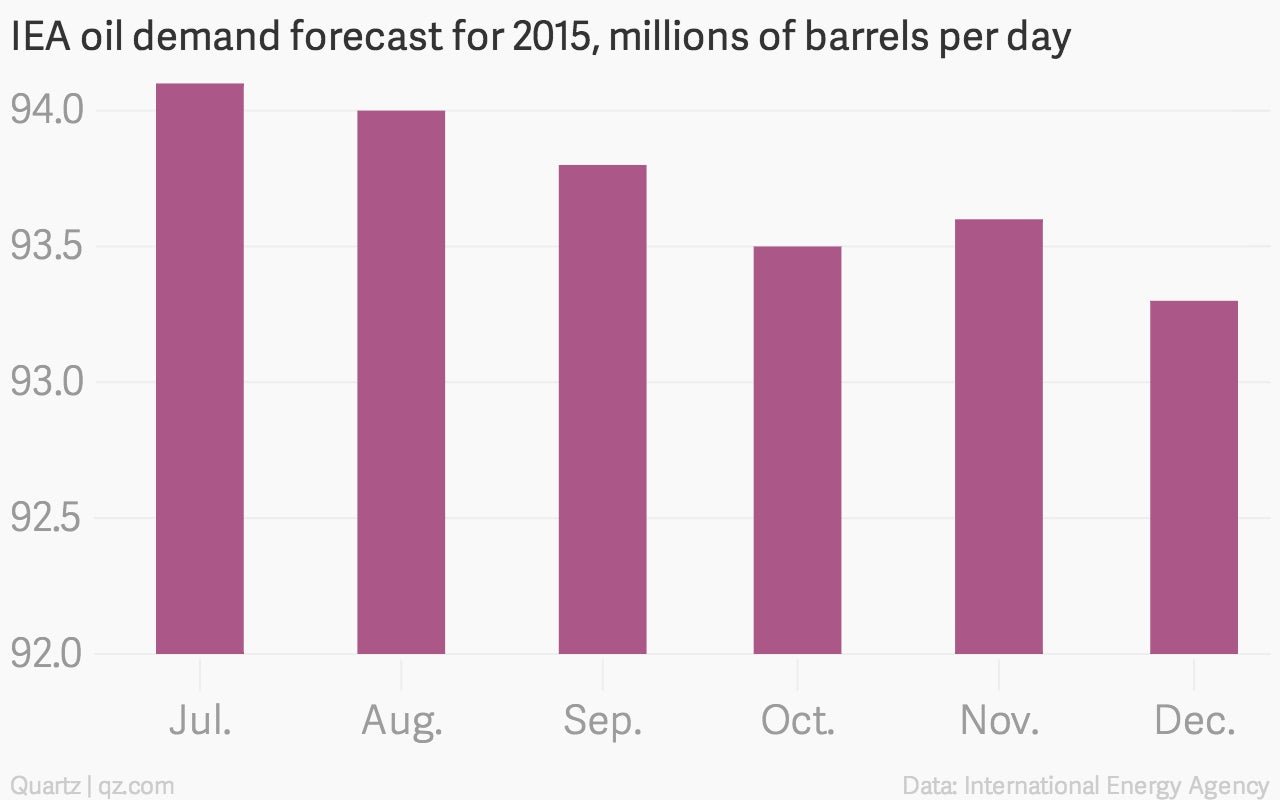
The International Energy Agency cut its 2015 oil consumption outlook again, as it’s done almost every month since it start making the projections in July.
This one’s an oil story too, in a way. The cost of making stuff is falling, led lower by two consecutive months of big energy savings—though prices are falling even without energy and food factored in.
Having already given up on using its foreign exchange reserves, the Central Bank of Russia is is again raising interest rates in order to draw investment, cut down on inflation and prop up the sinking ruble.
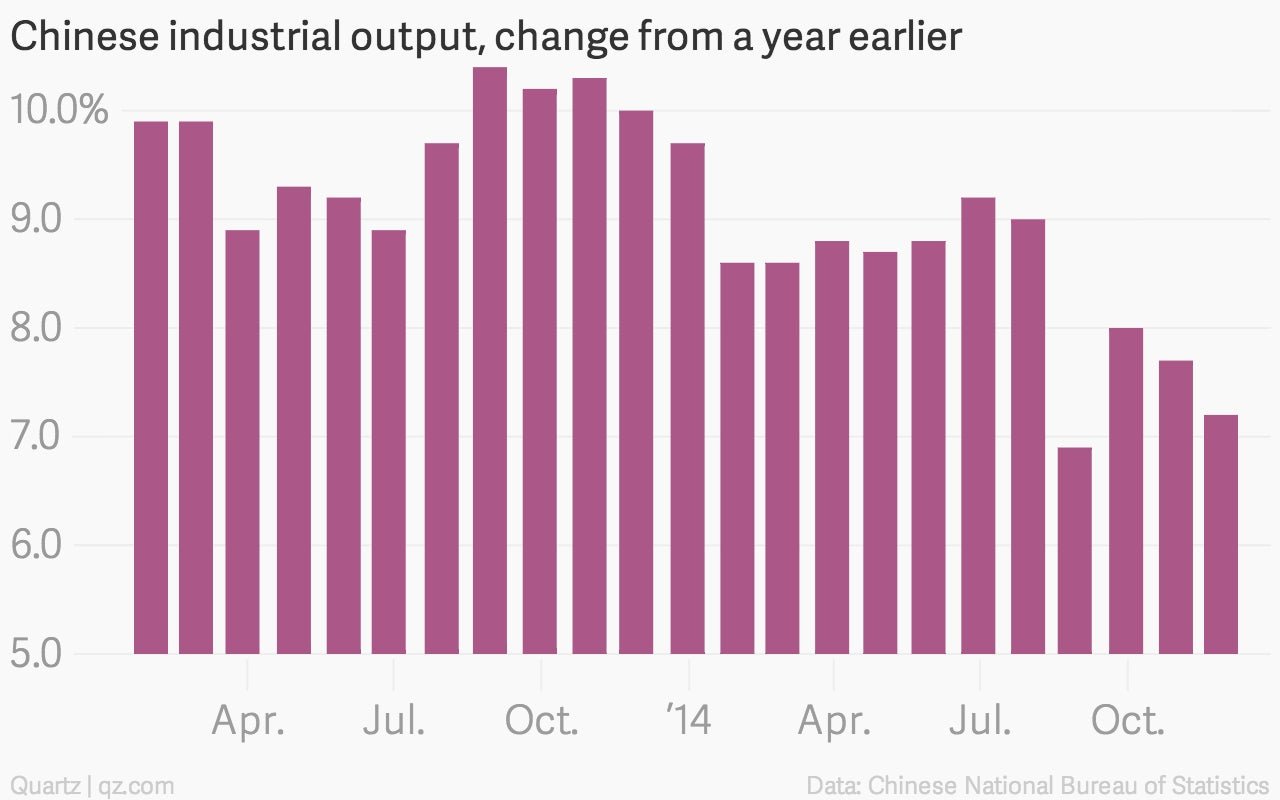
Slowing industrial production is another sign that one of the world’s hottest economies is cooling off.