What’s the difference between iPhone and Android users?
Well, iPhone users are smarter—that is, if you believe everything you read on the internet. (I do not advise this.)
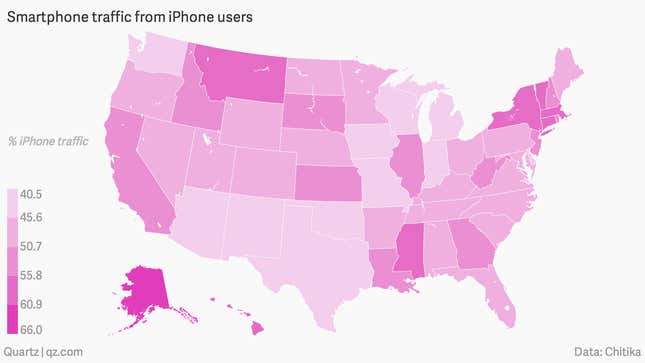
That narrative has emerged from a study published Jan. 22 by the American advertising firm Chitika, which found that states with higher education levels, higher median incomes, and higher population densities also had higher iPhone usage rates.
Apart from the conflating of “educated” with “smart,” it’s also actually pretty tenuous to conclude that iPhone users are more educated, based on this study. Since it just found a correlation on a statewide level, it doesn’t lead to solid conclusions about individual smartphone owners’ characteristics, because the people who are college-educated in each state may not necessarily be the same ones who own the iPhones.
But in fact, iPhone and Android users do have certain distinguishing characteristics and tendencies, even if this study doesn’t show it. A 2013 Pew study found that men are more likely to prefer Android phones than women, while people with a college education and incomes on the upper end of the spectrum were more likely to own an iPhone. Todd Hixon at Forbes used a tool called CivicScience to dig into the data in a little more detail.
Here’s what he concluded:
Android people include more hard-core techies: they work in technical jobs and are more comfortable with the more open but less polished Android user experience. And they are less affluent, so the generally lower price of Android phones appeals to them more. Perhaps we are seeing some of the “bro-grammer” culture here: male, deeply technical, and hard-drinking.
iPhone people are a notch up the socio-economic scale: higher income, higher education, higher representation in professional and managerial jobs. They are tech enthusiasts, but more as consumers than producers: a big over-weight for digital device addiction, but none for technical jobs.
Clearly, there is a difference. But it’s not as simple as, “iPhone users are smarter!”
Still, the Chitika study does provide some interesting data about iPhone penetration on a statewide level. Here’s a map of that data, gathered from a set of several hundred million iPhone ad impressions on Chitika’s mobile ad platform:

What does this mean? It’s hard to say. It’s tough to come up with any meaningful reasons Montana and Alaska would have a higher rate of iPhone usage than California and Texas. Certainly, if this data is not a fluke and significant geographic differences do exist on a statewide level, it would be interesting to find out the real reasons.
