Five charts that show how solid US consumers are now
With 70% of US economic activity tied to consumer spending, the consumer is ultimate arbiter of how well the US is going to do. And with the US still the world’s top economy and a crucial destination for exports from around the world, that means data on the US consumer are important to pretty much everyone with a stake in the global economy, which is, you know, everybody. So here are five charts that show how US consumers are holding up incredibly well.

With 70% of US economic activity tied to consumer spending, the consumer is ultimate arbiter of how well the US is going to do. And with the US still the world’s top economy and a crucial destination for exports from around the world, that means data on the US consumer are important to pretty much everyone with a stake in the global economy, which is, you know, everybody. So here are five charts that show how US consumers are holding up incredibly well.
Shopping!
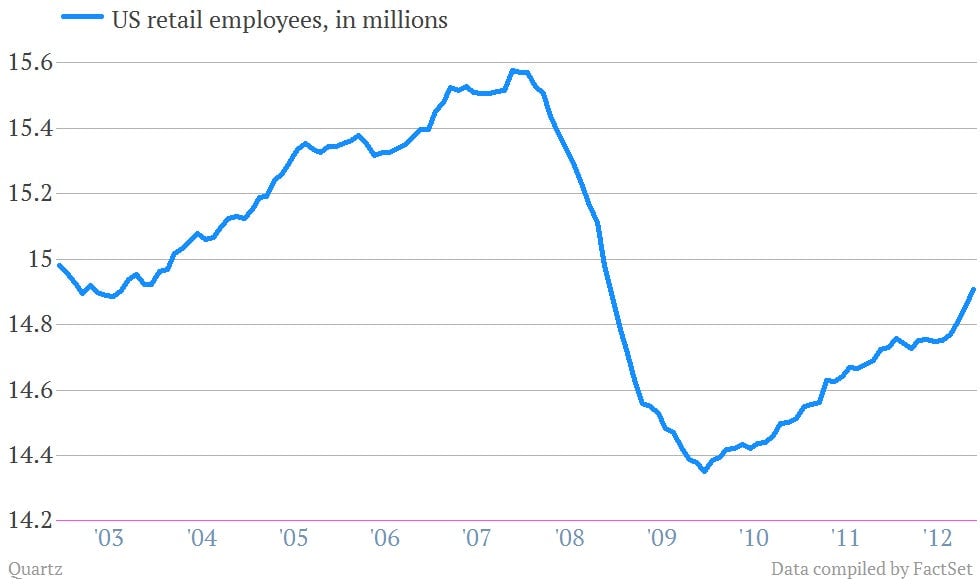
A surge in retail employment was one of the key features in today’s jobs report. Retail employment rose by 53,000 jobs. The big boost was likely tied to the post-Thanksgiving “Black Friday” shopping rush, so it’s possible that we could see some giveback on these jobs later, maybe after the new year. Still, stores wouldn’t be hiring this hard if they didn’t see solid signs of demand from consumers. Here’s a look at retail jobs going back 10 years. The pace of job growth is clearly picking up.
New wheels!
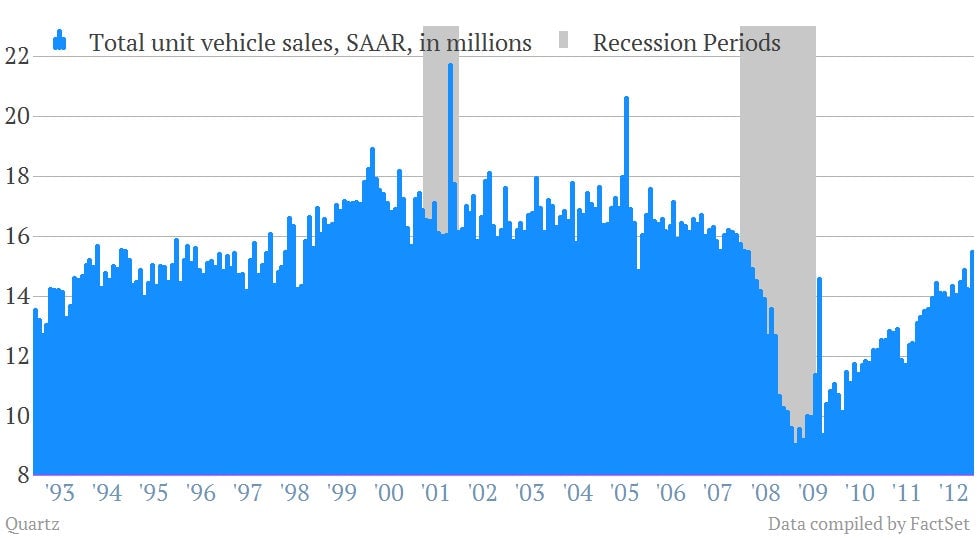
Auto sales are doing remarkably well, thanks to rock bottom interest rates and agressive pricing from auto makers. It’s moving a lot of merch off the lots. November’s seasonally adjusted annualized rate of sales was 15.5 million units, the best since January 2008.
We’re Rich Again!
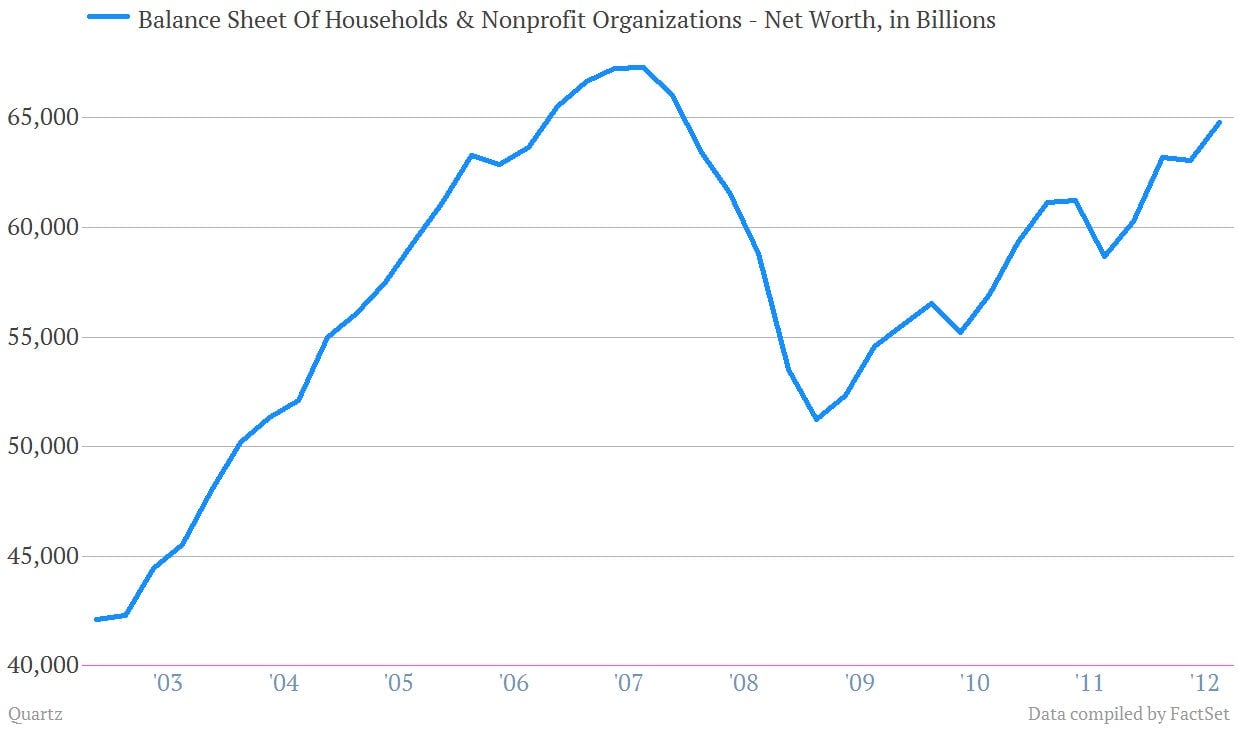
US household net worth has bounced almost back to normal since the worst of the recession, according to the latest Federal Reserve “flow of funds” data. So even if Americans aren’t exactly rich, they’re feeling a lot better, largely owing to the improving dynamics of the housing market.
Getting paid!
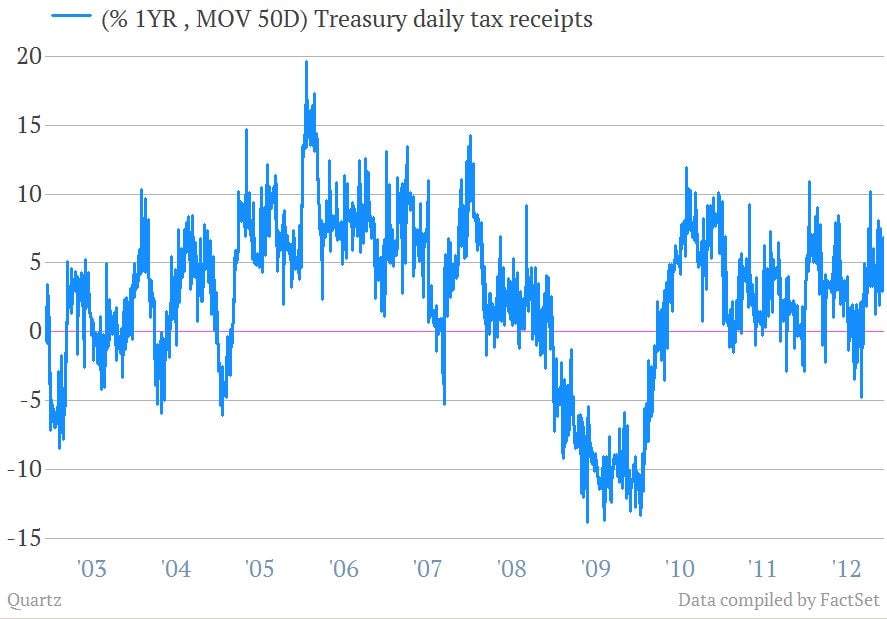
Here’s one of our favorite economic tidbits to watch. It’s the US Treasury Department’s daily tally of withheld tax receipts. It gives you a sense of the shape of US paychecks. It’s a noisy mess if you look at it completely unfiltered, so we slapped a 50-day moving average on it to try to discern the trends. And then we look at the year-over-year percentage change. You can see that withholdings were starting to weaken early in the fall, hitting their lows in early September. But they’ve bounced back nicely, suggesting that household income remains solid, which bodes well for spending.
Looking for loans, too!
Demand for money is picking up, as well. A good sign, seeing as the Fed has been trying to spur such demand with its low interest rate policy. It looks like it is starting to gain traction. Here’s a look at data from the Federal Reserve’s senior loan officer survey, which show the percentage of net respondents reporting higher demand for prime mortgage loans moving steadily higher.
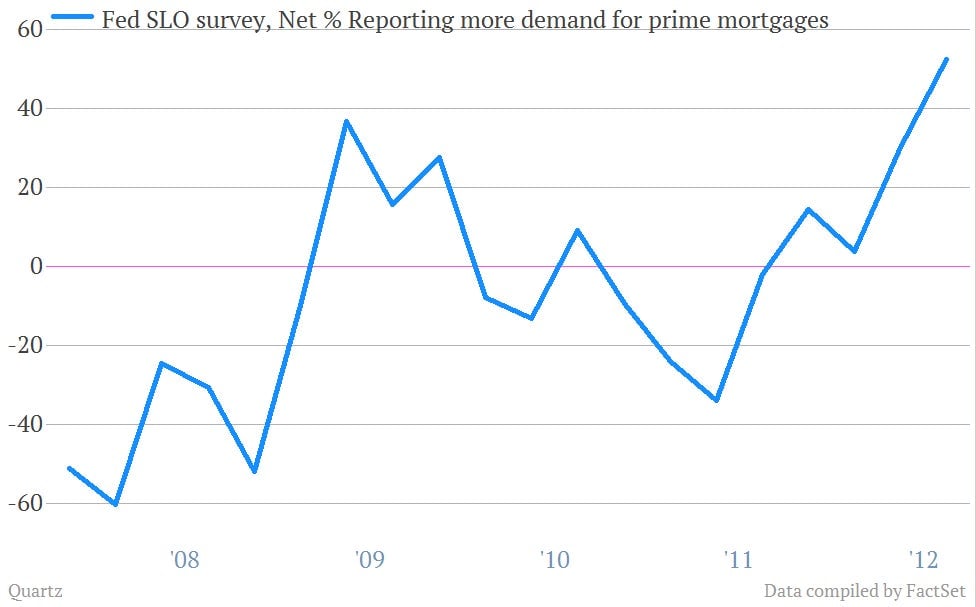
In short, don’t sleep on the American consumer. It’s possible that the fiscal cliff could derail all of this momentum if there is additional chaos to come. But with the sturdy shoulders of the US consumer carrying the economy, even a decent resolution to the cliff drama could set the stage for notable expansion in US economic activity.