The 11 most important economic charts of the week

By
We may earn a commission from links on this page.

GDP

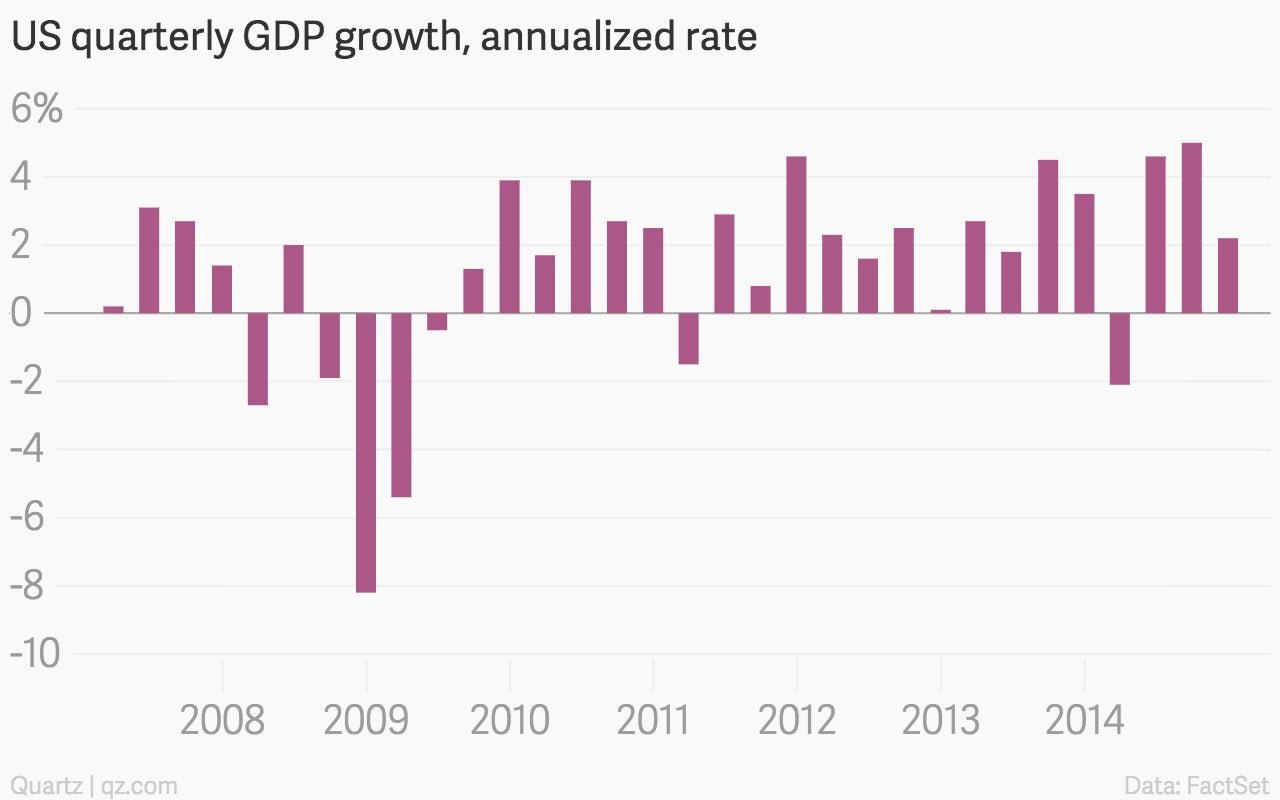
Last quarter’s sharp slowdown in US economic growth was confirmed

Image for article titled The 11 most important economic charts of the week


The same thing happened in France…
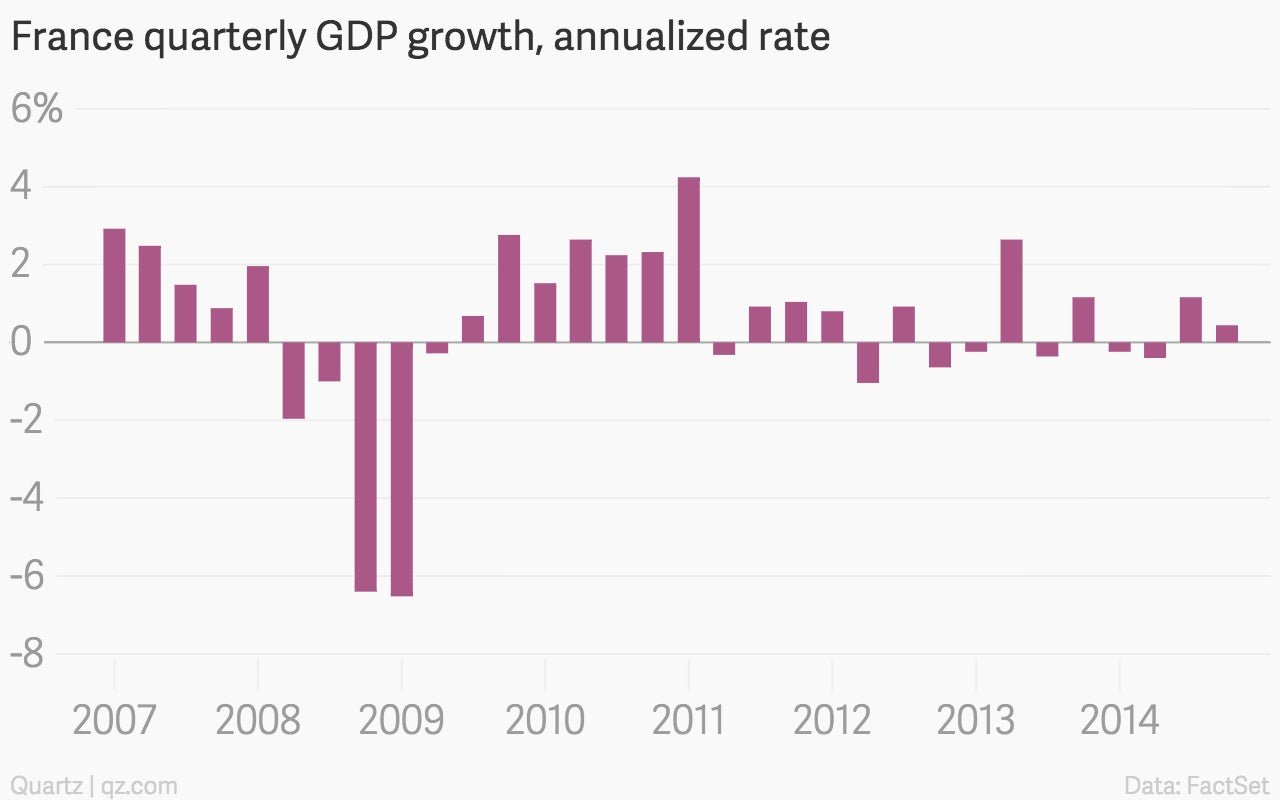
Image for article titled The 11 most important economic charts of the week

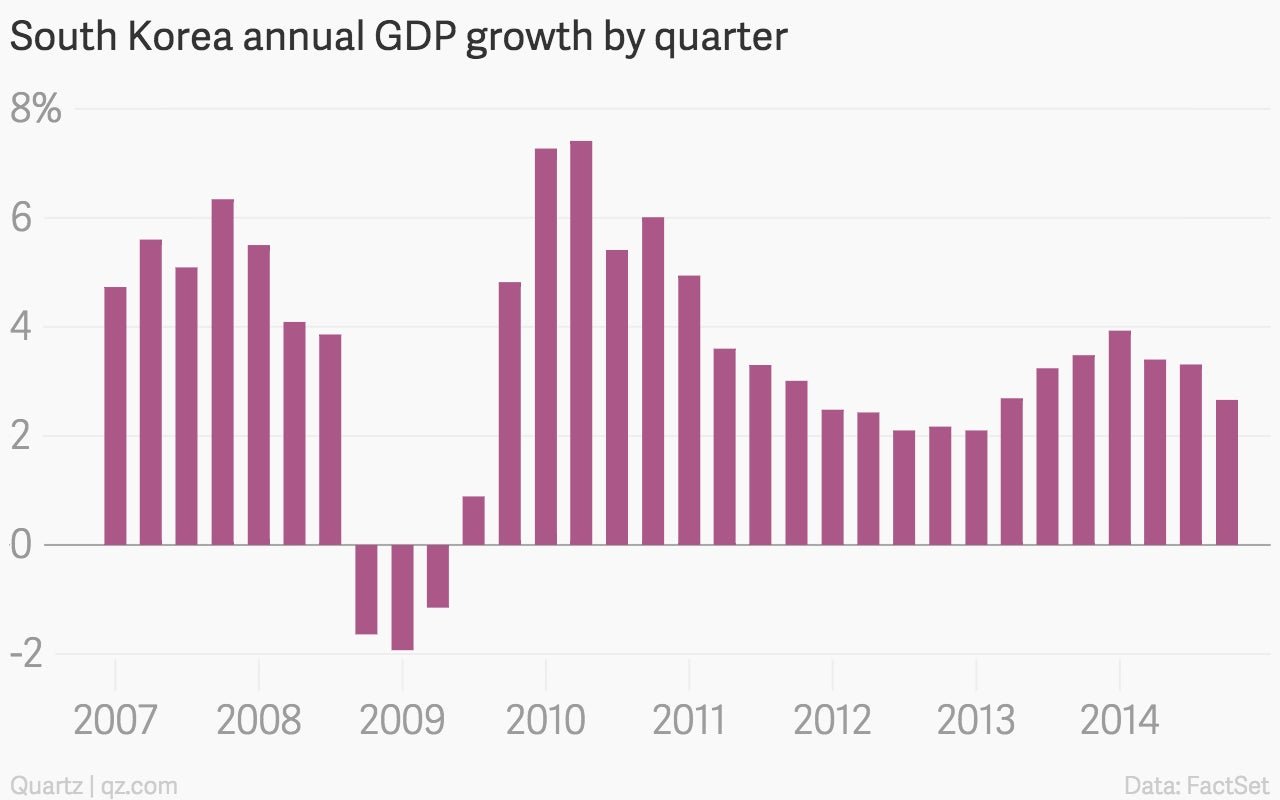
…and South Korea

Image for article titled The 11 most important economic charts of the week

Brazil’s economy, on the other hand, grew faster than expected
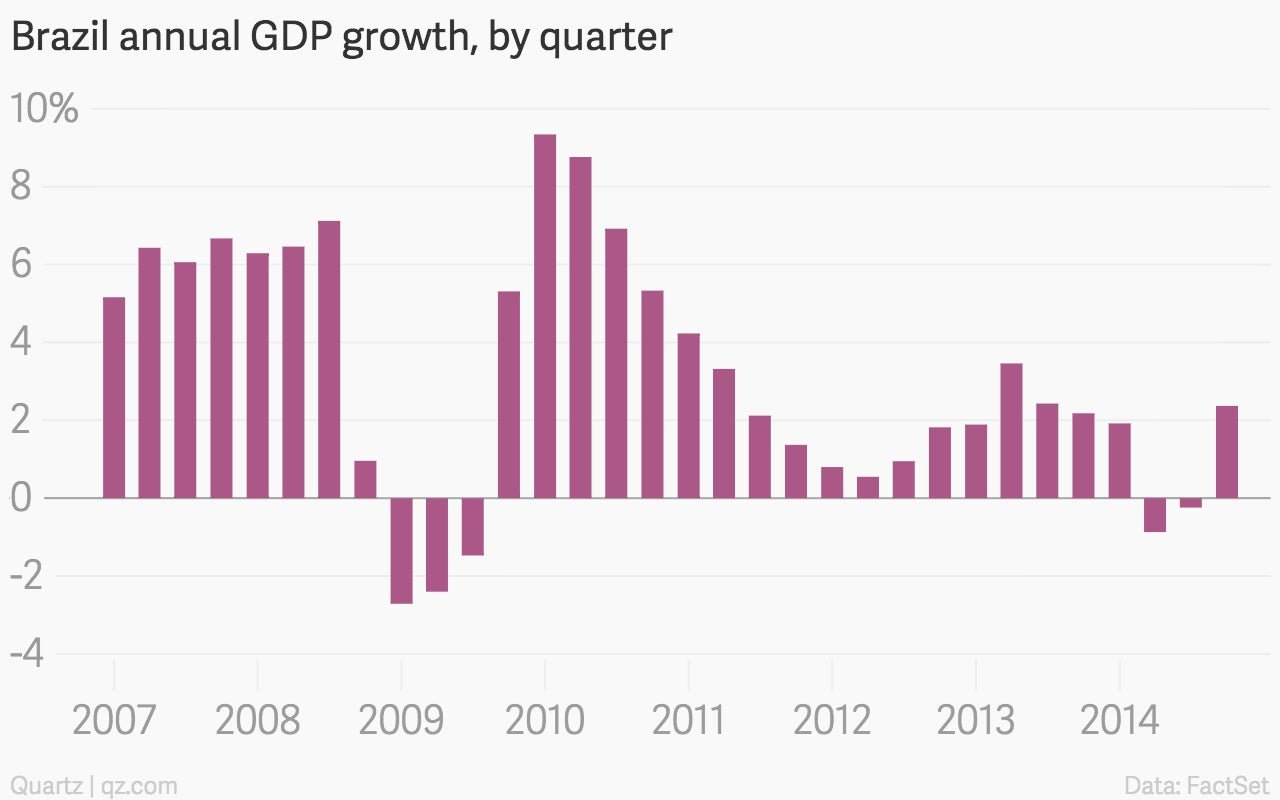
Image for article titled The 11 most important economic charts of the week

CPI

The US saw no (headline) inflation last month

Image for article titled The 11 most important economic charts of the week

Neither—for the first time on record—did the UK
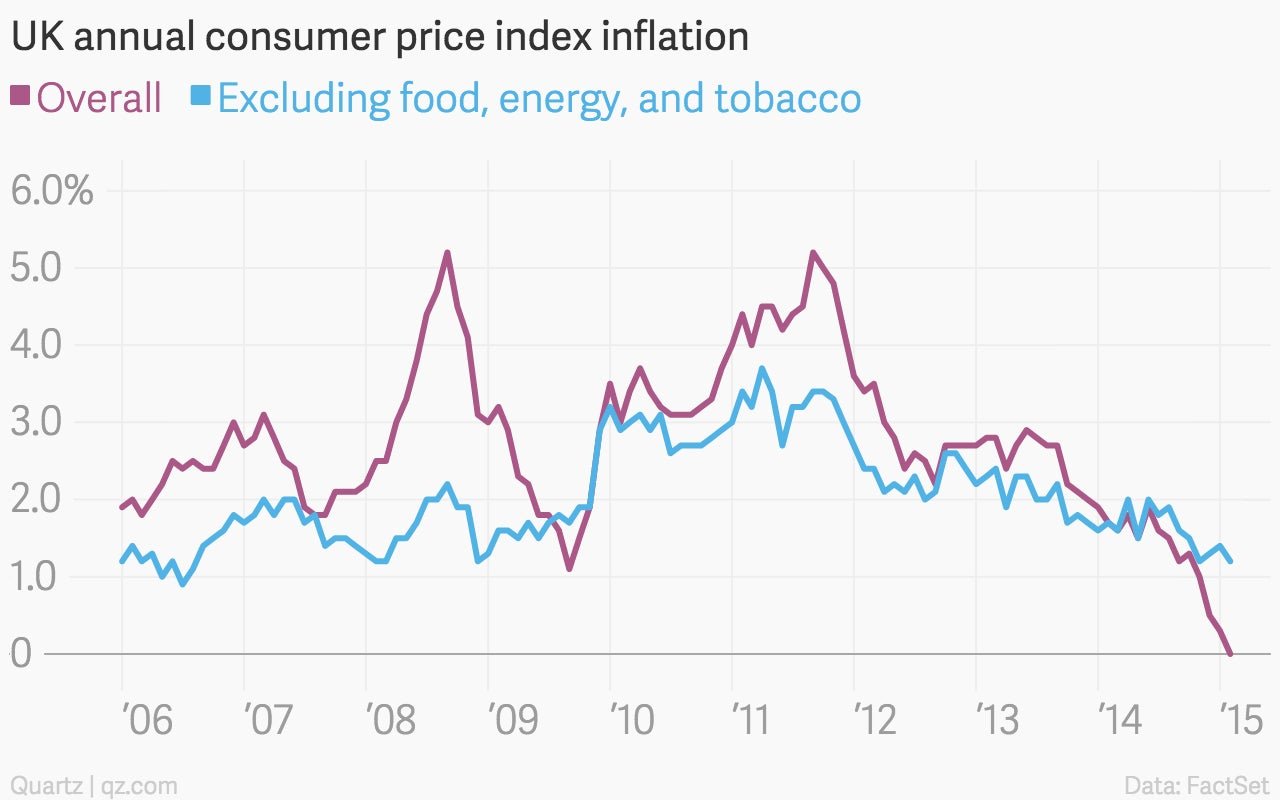
Image for article titled The 11 most important economic charts of the week

Inflation is also slowing sharply in Japan (and if you account for the effects of last year’s sales tax hikes, prices didn’t grow at all)
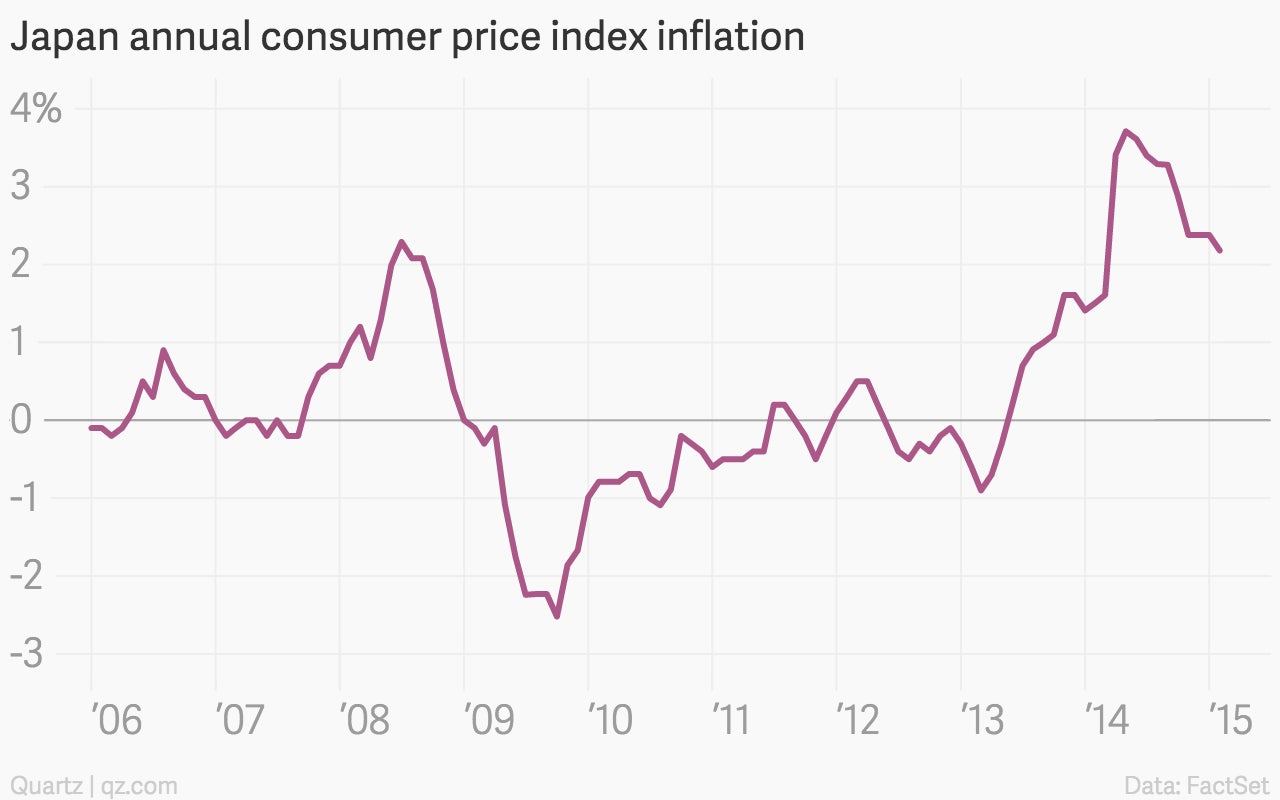
Image for article titled The 11 most important economic charts of the week

Etc.

US oil supplies continue to climb
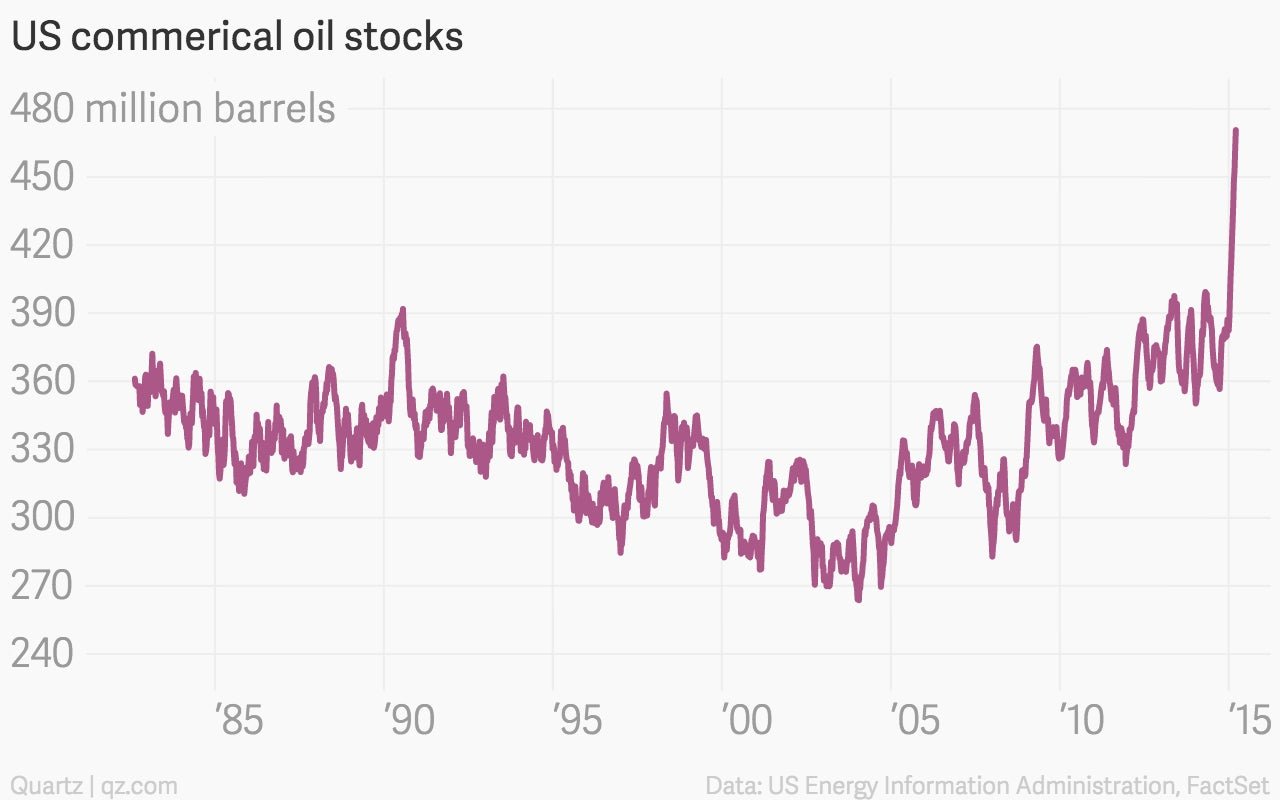
Image for article titled The 11 most important economic charts of the week

Argentina’s industrial production continued to slow down
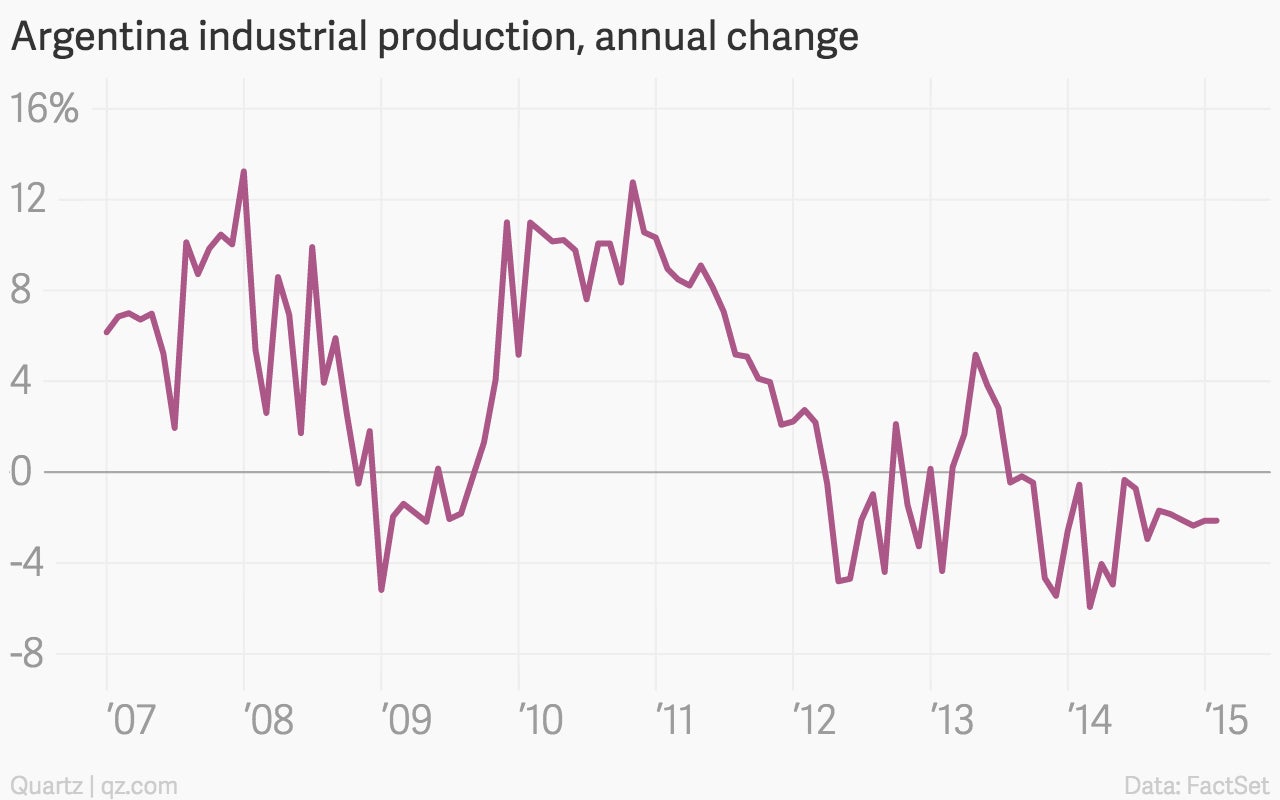
Image for article titled The 11 most important economic charts of the week

The Nigerian naira remains stable ahead of the country’s March 28 elections…
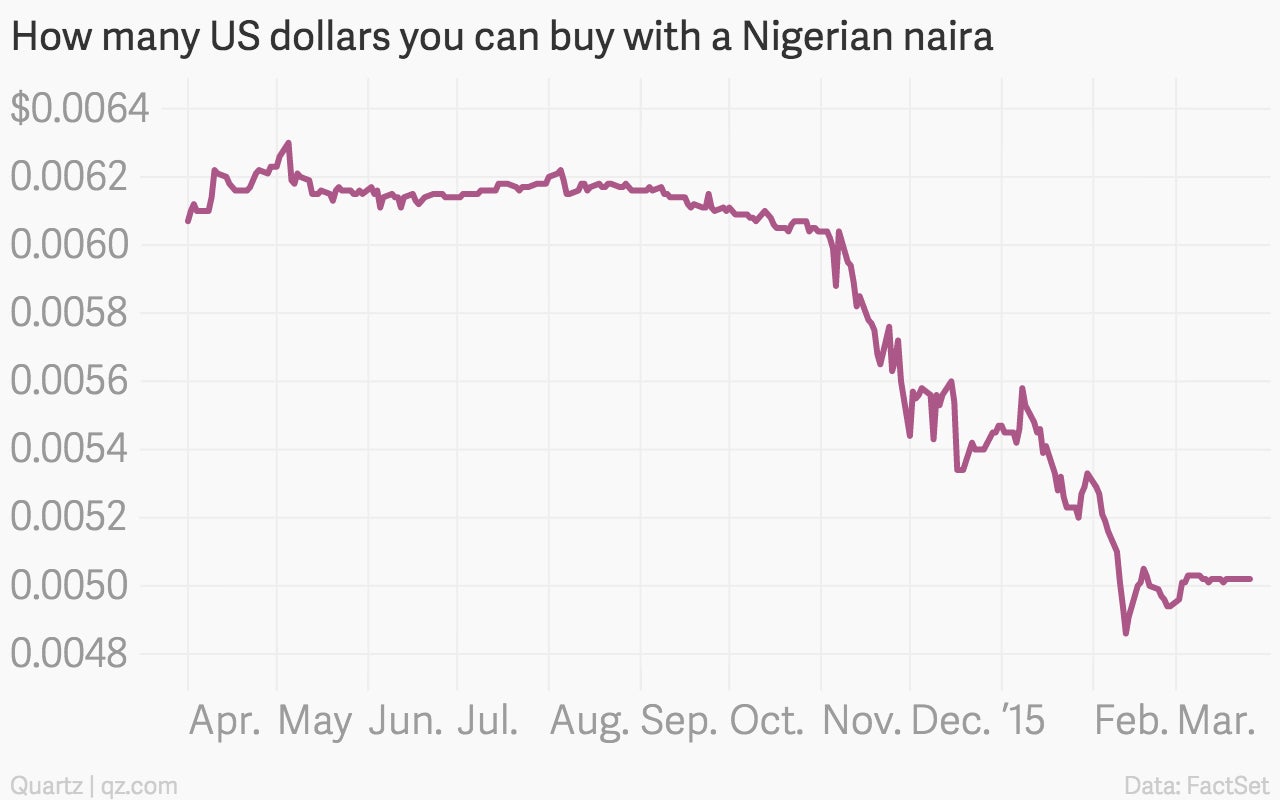
Image for article titled The 11 most important economic charts of the week

…though you can’t say the same about the country’s foreign exchange holdings

Image for article titled The 11 most important economic charts of the week