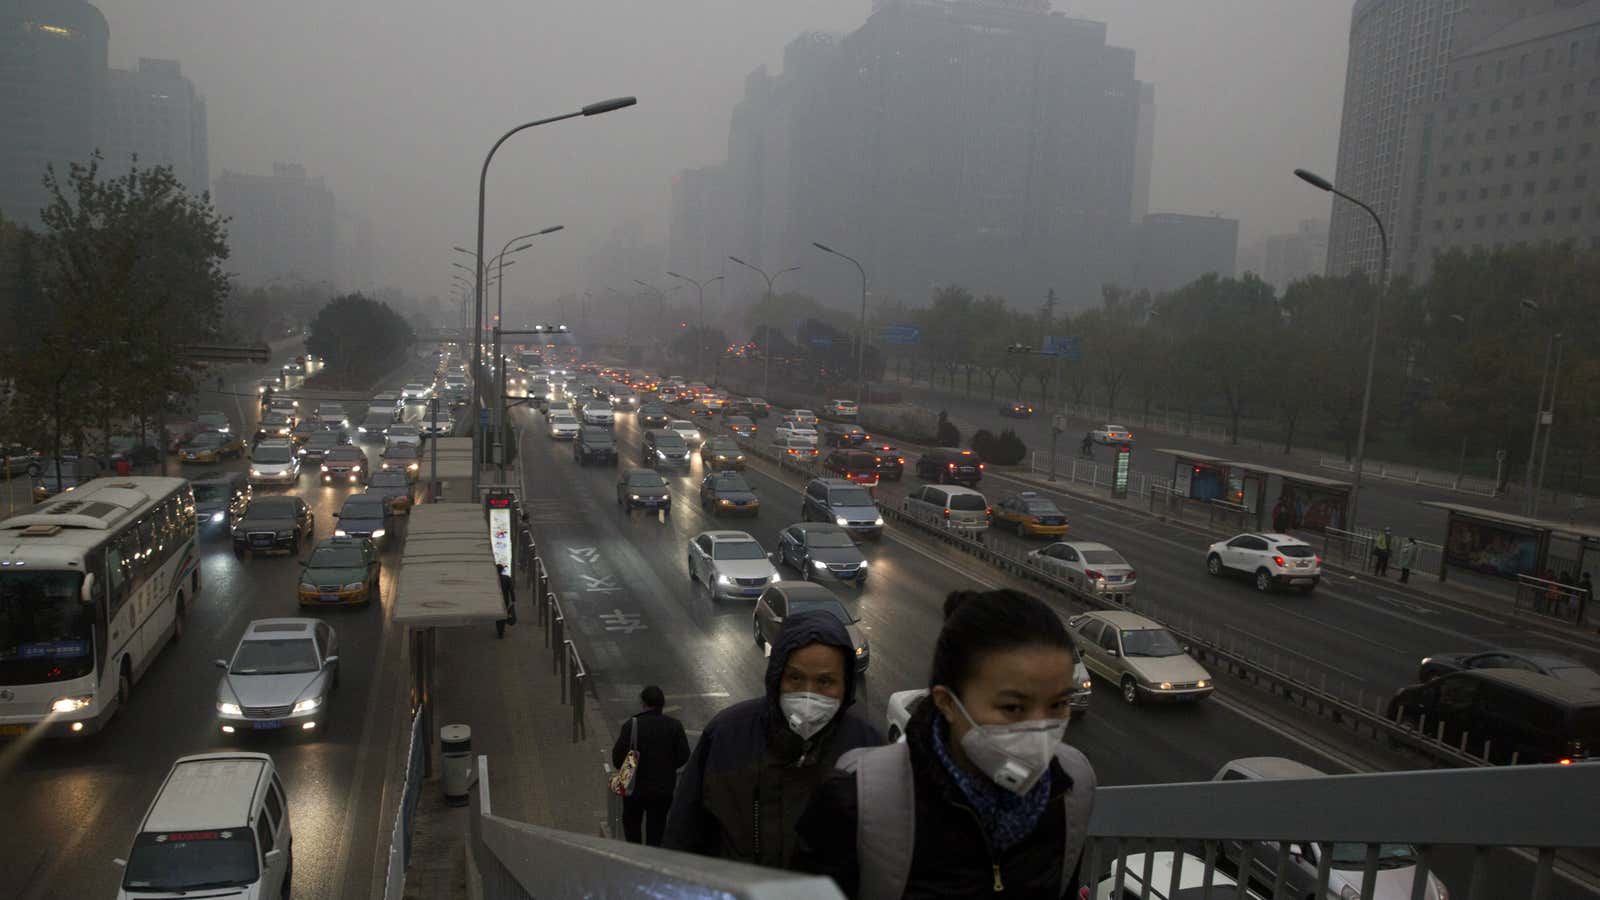
Every year, outdoor air pollution kills more people worldwide than malaria and HIV combined. People in China, particularly in its largest cities, are some of the most affected, since the country’s rapid economic growth has come at the cost of air quality. This issue remained largely unaddressed until the US embassy in Beijing began to tweet out air quality data in 2008, providing a remarkable demonstration of the transformative power of democratizing data. The tweets sparked an energetic environmental movement that forced China’s leaders to acknowledge the massive scale of the problem and begin to take measures to combat it.
The initiative to publicize air quality data was subsequently expanded to US consulates in several major Chinese cities, providing a wealth of new scientific data. I recently worked with Federico San Martini and Christa Hasenkopf (both atmospheric scientists at the US State Department who are involved in this program) to analyze this data.
Comparing concentrations of PM2.5—one of the most dangerous types of air pollution—we found some remarkable patterns in how it changes over the course of the days and seasons across various cities. The highest levels of pollution in Beijing are at midnight, for example—which the recent Chinese documentary Under the Dome blamed on exhaust-spewing heavy trucks making overnight deliveries, but is more likely due to meteorological conditions.
This should be just the beginning. Certainly, we can expect more data to emerge from China, which recently established a robust monitoring system. And more data from the around the world should become available as the US embassy air quality monitoring program expands to additional countries, including India.
This increase in publicly available air pollution data, if provided in an easily understandable form , will give not only scientists but also citizens the opportunity to drive the conversation on air pollution towards cleaner air.
Additional reporting by Quartz’s David Yanofsky.


