Before the big jobs report hits at 8:30 a.m., check out these charts. Though there is still a long way to go, they tell a clear story of improvement in the US labor market.
UPDATE: The latest numbers are in. Check out Quartz’s informative, graphical looks at the data here and here.
Before the big jobs report hits at 8:30 a.m., check out these charts. Though there is still a long way to go, they tell a clear story of improvement in the US labor market.
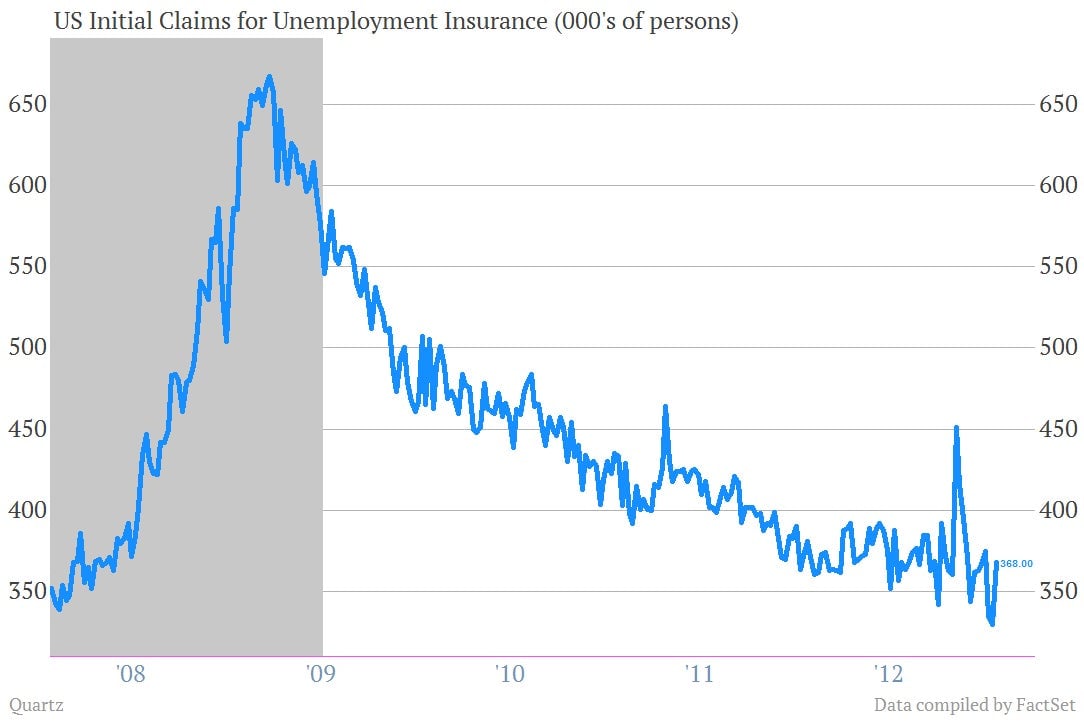
Weekly jobless claims are now below the 400,000-level that has long been seen as a barrier to sustainable job creation.
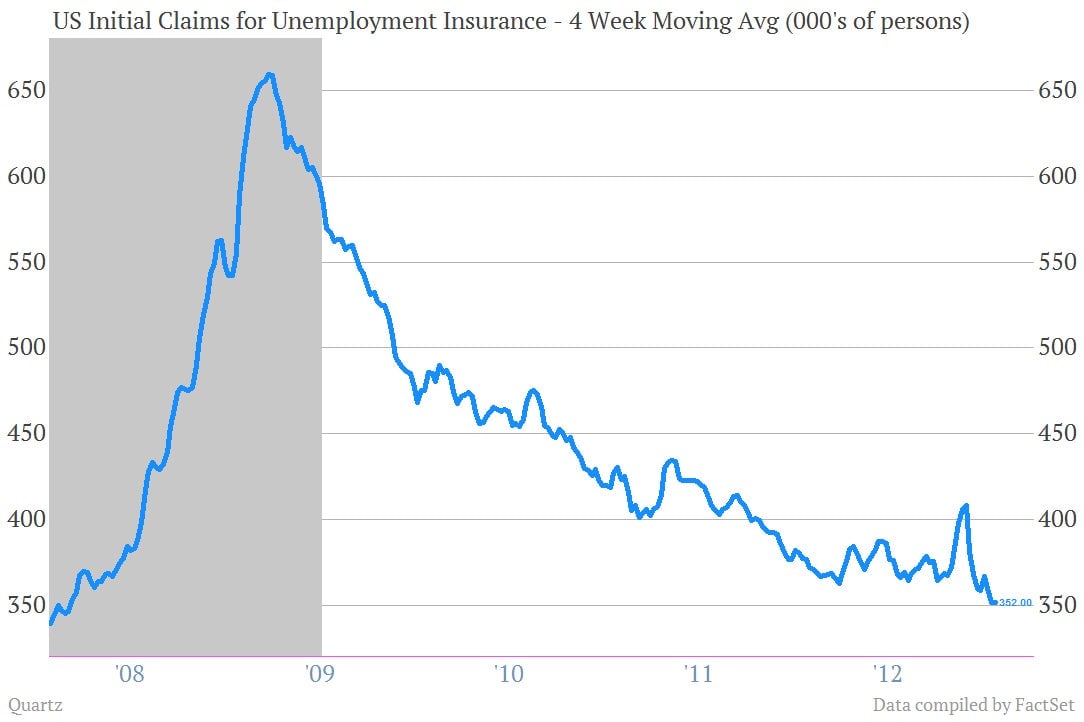
Even taking the recent spike higher into account, the four-week moving average—which gives a clearer sense of the trend—is at its lowest point since 2008.