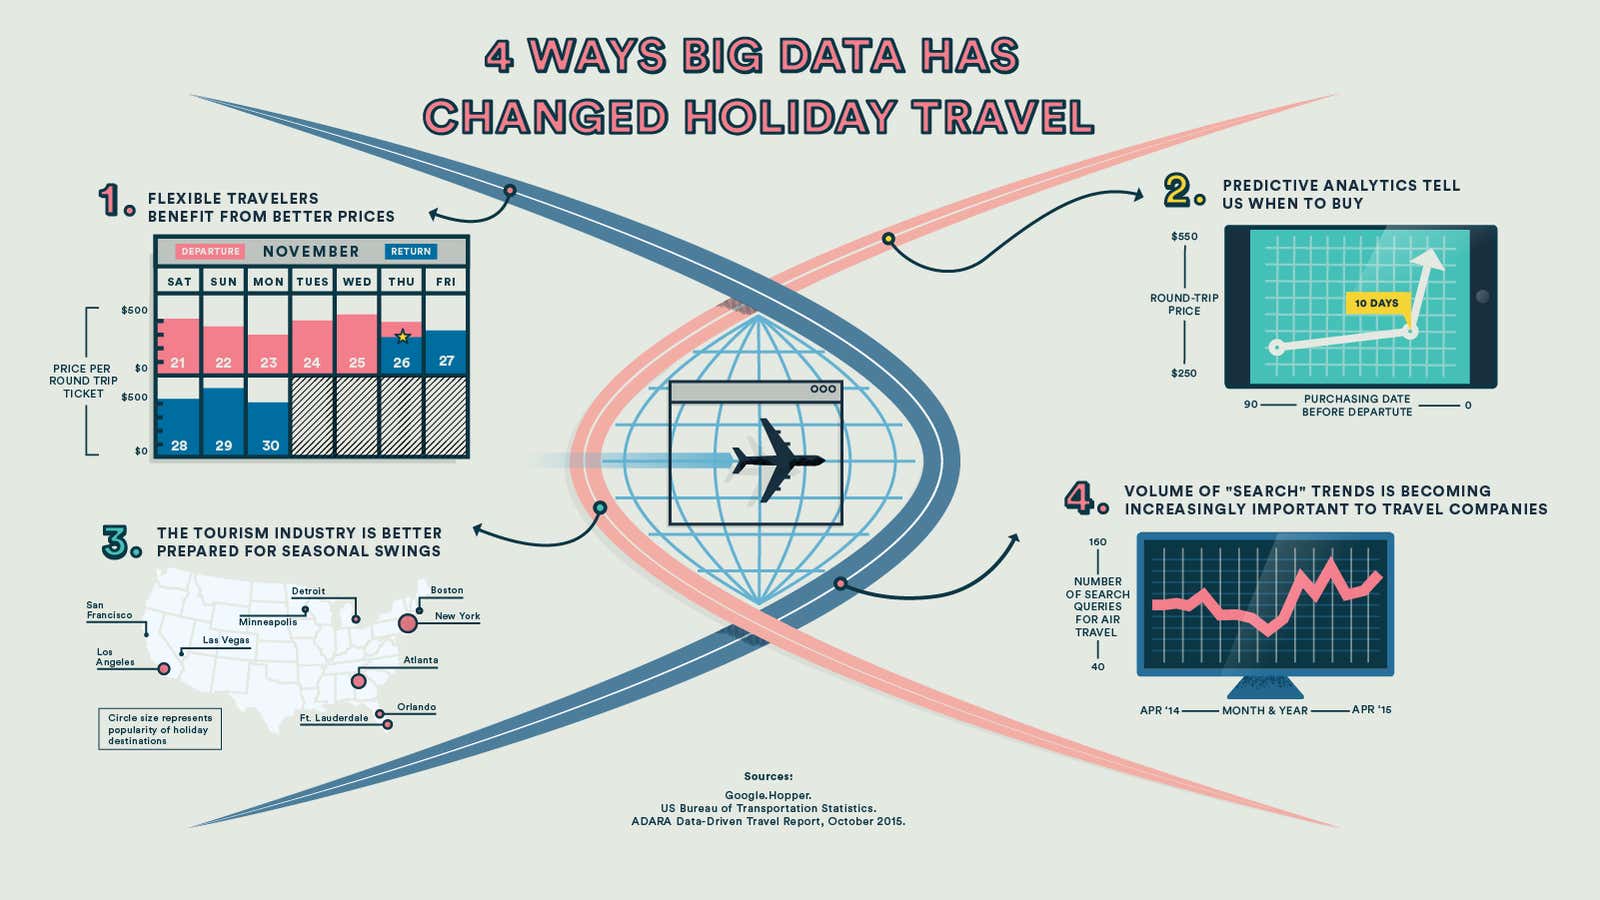
(See infographic enlarged.)
Twenty years ago, the internet first served to connect consumers with travel industry brokers that no longer needed a brick-and-mortar shop to sell their wares. Yes, the economy looked bright, but the introduction of online, transparent marketplaces drove competition, eased ticket-buying and spurred demand.
Twenty years later, the ubiquity of mobile technology and the seemingly limitless data produced has redefined the way we plan and pay for our travel experiences and engage with airlines. Airlines are working hard to extract value from the troves of Big Data available to them. And consumers are demanding more personalized, intuitive and instantaneous mobile travel products and interfaces.
In an evolving travel space, we’re still learning how technology will affect one of the busiest travel times of the year: the winter holidays. The infographic above (and corresponding text below) is a snapshot of the data driving those trends, and how advancing analytics are harnessing it.
- There’s a growing marketplace for apps that have mastered predictive analytics, especially when it comes to airfare. For example, travel research company Hopper has mapped out the best times to book for the holidays this year. Some of their findings suggest that travelers generally have little flexibility, so prices for Thanksgiving are always going to be high. Still, there’s some good news: prices for Thanksgiving this year are trending about 5-10% below last year. Pro tip: Flying on Thanksgiving Day will be cheapest, of course, as demand is lowest, but travelers can save a little by flying on Friday or Monday, instead.
- Further research shows that, on average, the best time to book is about 80 days before you travel. But, unlike Thanksgiving prices, Christmas flight prices tend to rise steadily and spike 10 days prior to the holiday. Typically, average round-trip holiday airfare increases by about $1.60 for each day we get closer to Christmas.
- Those kinds of predictions are useful not only for consumers, but for seasonal industries and travel companies. Google Trends analyzes a percentage of web searches to figure out how many were done over a certain period of time. Then, they index and normalize the volume, meaning you can track the index to see the popularity of web searches relative to how many other users are searching at the same time and location. Through mid-2015, data on trends in mobile search volume shows that hotels, tours and attractions, car rentals and cruises all jumped by a 47%-49% change, year-over-year, from 2014. Search for air travel peaked in July, and was up 4% overall compared to 2014.
A systematic approach to data can help tourism boards and local shops prepare more precisely for an influx of customers. In the domestic United States, 70% of travelers are visiting the Eastern Seaboard or the Midwest over the holidays. Perhaps unsurprisingly, 60% of travelers from the Northeast travel to Florida, looking to escape the cold. And—other than NYC—folks from the Midwest are looking to warm up, mainly in Atlanta, Las Vegas, and San Francisco. These numbers are useful: Knowing when customers are booking helps local businesses adjust supplies and pricing to meet demand.
Read more from HPE Matter’s Next Enterprise issue here.
This article was produced on behalf of HPE Matter by the Quartz marketing team and not by the Quartz editorial staff.
