The first step to eliminating poverty is identifying the regions most by plagued it.
The first step to eliminating poverty is identifying the regions most by plagued it.
In 2015, the United Nations Sustainable Development Goals set forth 17 global missions. One of the most ambitious is to eliminate poverty by 2030. But, currently, on-the-ground economic measures are sparse and sometimes unreliable in poorer countries, which lack resources to collect accurate data. Much of the data from Sub-Saharan African countries is not well-documented, edited, or released to the public domain, according to the World Bank.
Join 500,000+ readers who start their day with Quartz.
By subscribing, you agree to our Terms of Service and Privacy Policy.
“How are we going to know if we’ve eliminated poverty if we don’t collect data?” says Marshall Burke, an assistant professor in Stanford University’s Department of Earth System Science. “It’s like setting a weight loss goal but not having a scale to know if you’ve made any progress.”
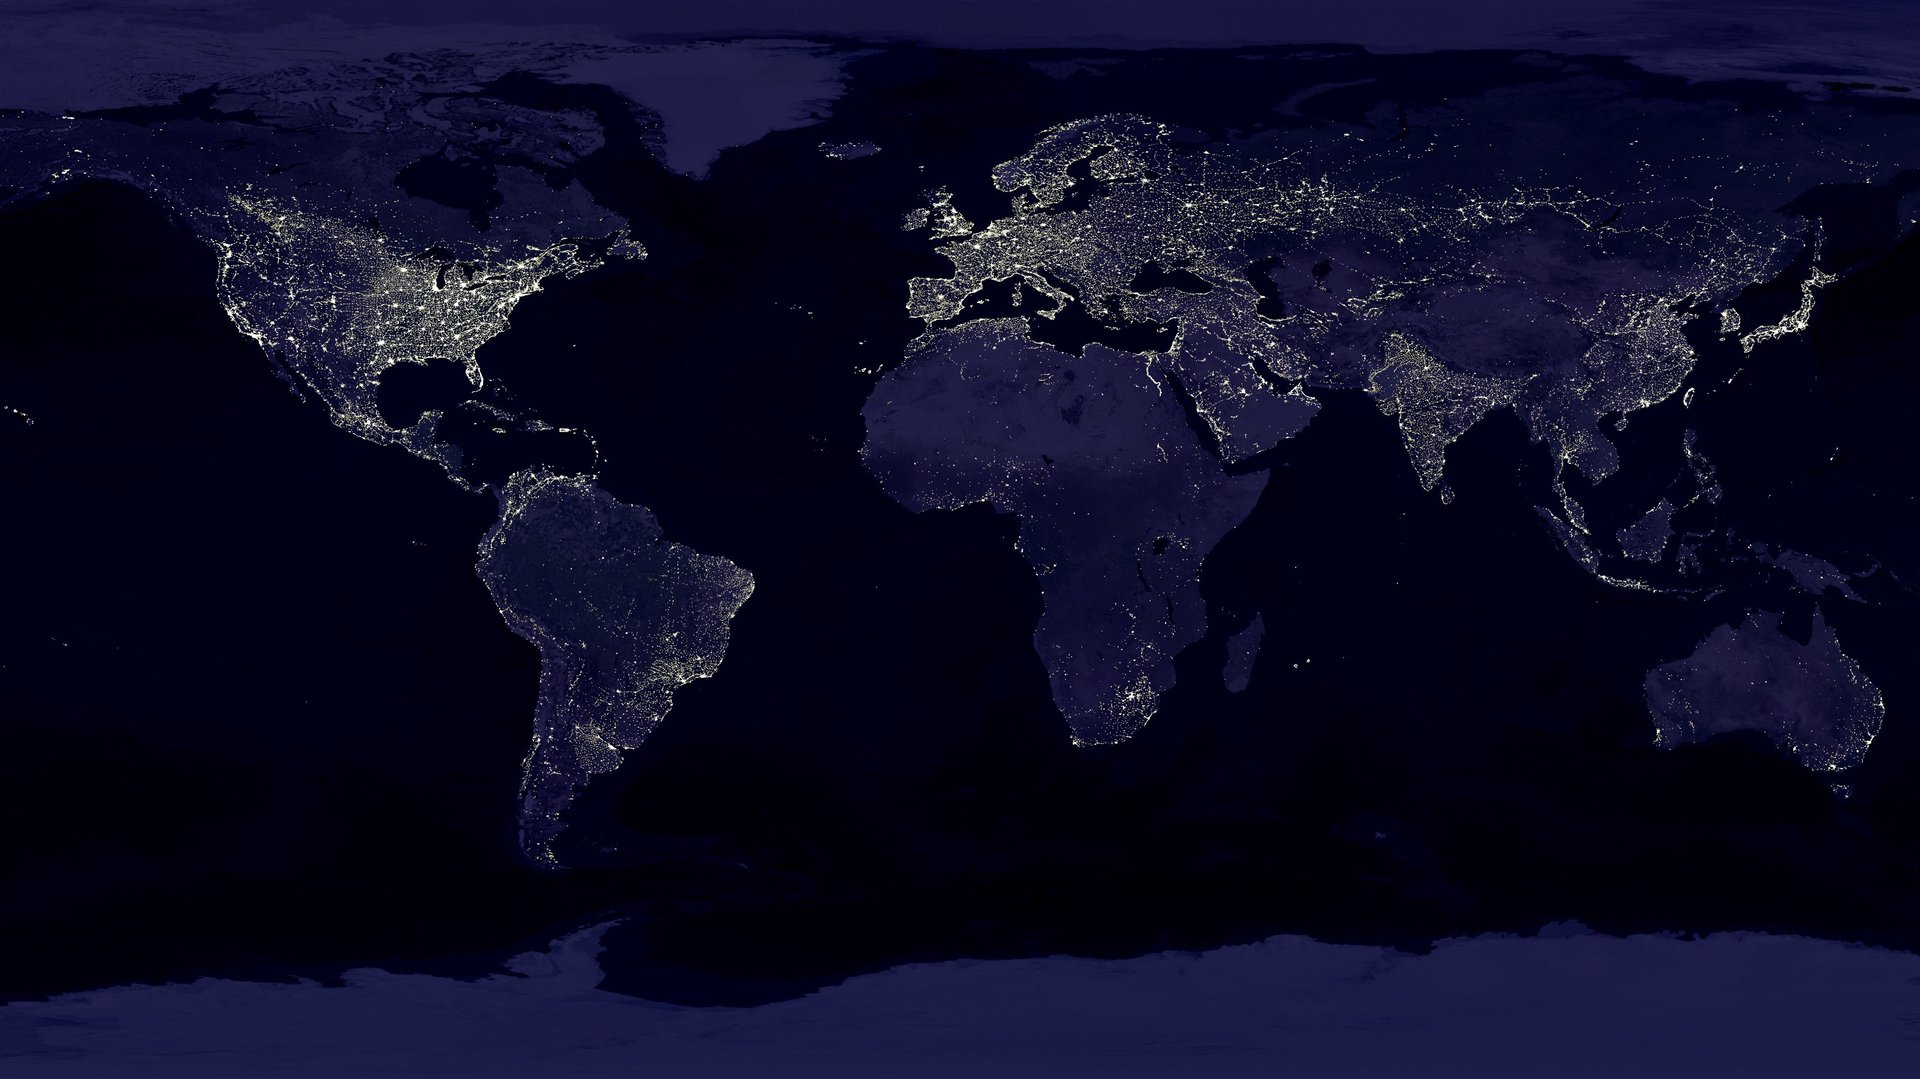
One solution might be to take a satellite’s-eye-view of the planet. Looking down from outer space, places on earth that appear brighter at night tend to be the most developed. In impoverished areas, luminosity levels are lower. The World Bank has previously used “night lights” from nighttime maps to measure regional inequality income inequality in Africa. Using it as a proxy for economic well being, Burke and a team of researchers have developed an algorithm that’s better at predicting poverty than all existing methods. They wrote up their work in a study published in the journal Science today (Aug. 19).
To create the model, researchers fed three inputs into a computer: nighttime luminosity data, daytime high-resolution imagery, and actual survey data about measuring two factors: consumption expenditure, which measures household spending, and asset wealth, which includes cars, TVs and other goods owned. The researchers chose five countries from the continent—Nigeria, Tanzania, Uganda, Malawi, and Rwanda—which had recently collected high-quality household data.
A two-step process called “transfer learning” is used to train the algorithm: First, data on night light and daytime images are combined. The computer starts mapping things like roads, urban areas, waterways and farmland. Then, the model looks for correlations. For instance, areas with houses and cars are likely to be more lit than barren regions. Second, the model ingests the actual survey data and checks it against the correlations, learning, for example, that areas with more cars are also more likely to rare higher on household spending in the surveys. Then, the magic: the model takes all that and uses the map to make predictions that fills gaps where there isn’t good data.
So far, the researchers have been able to accurately estimate household consumption and asset wealth more than half of the time. They say their model is more effective than using both satellite imagery or household data independently, or any other existing methods.
The other great thing about the tool? The price. It’s “nearly costless to scale across countries,” the researchers write in their paper. All the hi-res imagery used for the project was free, from Google $GOOGL Maps. All the code is open-source so anyone can download and modify it. With more satellite imagery expected to be made publicly available soon, from the European Space Agency and other organizations, modified models can ingest new data and make predictions across time and regions. Right now, says Burke, they can estimate a snapshot of the state of poverty. But to make predictions about the future, they’d need a bunch of snapshots to see how things have changed over time. In the foreseeable future, the team hopes to “make maps that can update all the time,” Burke says, as more hi-res imagery is made available and patterns emerge over the years.
The new way of tracking poverty can replace door-to-door household surveys, which are typically expensive and “institutionally difficult, as some governments see little benefit in having their lackluster performance documented,” the researchers write. Eventually, Burke and his co-authors hope that governments and organizations across the world will no longer bet blindly on their anti-poverty efforts, but really figure out what’s working and what’s not. “They can use [the model] as a tool to evaluate anti-poverty programs that they don’t get to do, mainly for lack of data.”