Climate change is no joke.
Climate change is no joke.
In the past decade, the effects of climbing global temperatures have started to kick in—drowning islands, deadly oysters, and natural disasters (some can even be seen from space) are dramatically changing life on Earth not for future generations, but for those here today. This summer we lived through the warmest August in 136 years. Despite the preponderance of evidence to the contrary, many people still deny that these changes have been brought on by human activity, arguing that global temperatures have fluctuated before, and this is just another normal shift.
Join 500,000+ readers who start their day with Quartz.
By subscribing, you agree to our Terms of Service and Privacy Policy.
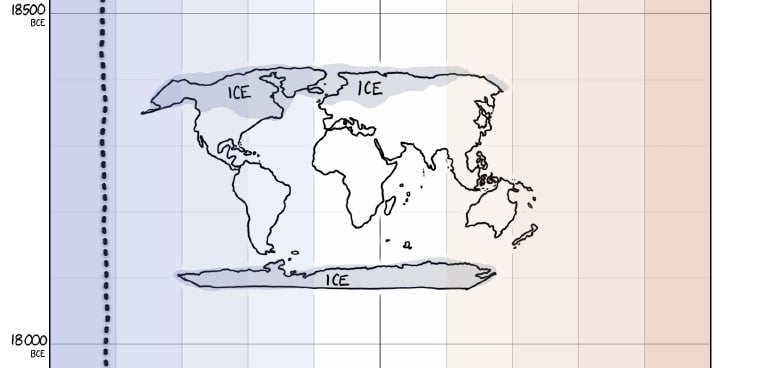
Using stick figures and comedy, former NASA employee and XKCD cartoonist Randall Munroe smashed that argument to pieces. With delightful humor and scientific accuracy (he used scientific papers and datasets for reference), his cartoon shows the whole human history through the lens of climate change—and shows how previous global temperature changes took thousands of years to happen, and that this time, climate change has happened in a geological blink of an eye.
Here are some snippets of his timeline covering more than 22,000 years history of mankind:


