Some—like, say, us—might scoff at using GDP to gauge human well-being. But the measure—of total value of goods and services in the economy—deserves attention from those trying to track the supertanker that is the US economy. So here’s how today’s report on first-quarter GDP panned out.

Some—like, say, us—might scoff at using GDP to gauge human well-being. But the measure—of total value of goods and services in the economy—deserves attention from those trying to track the supertanker that is the US economy. So here’s how today’s report on first-quarter GDP panned out.
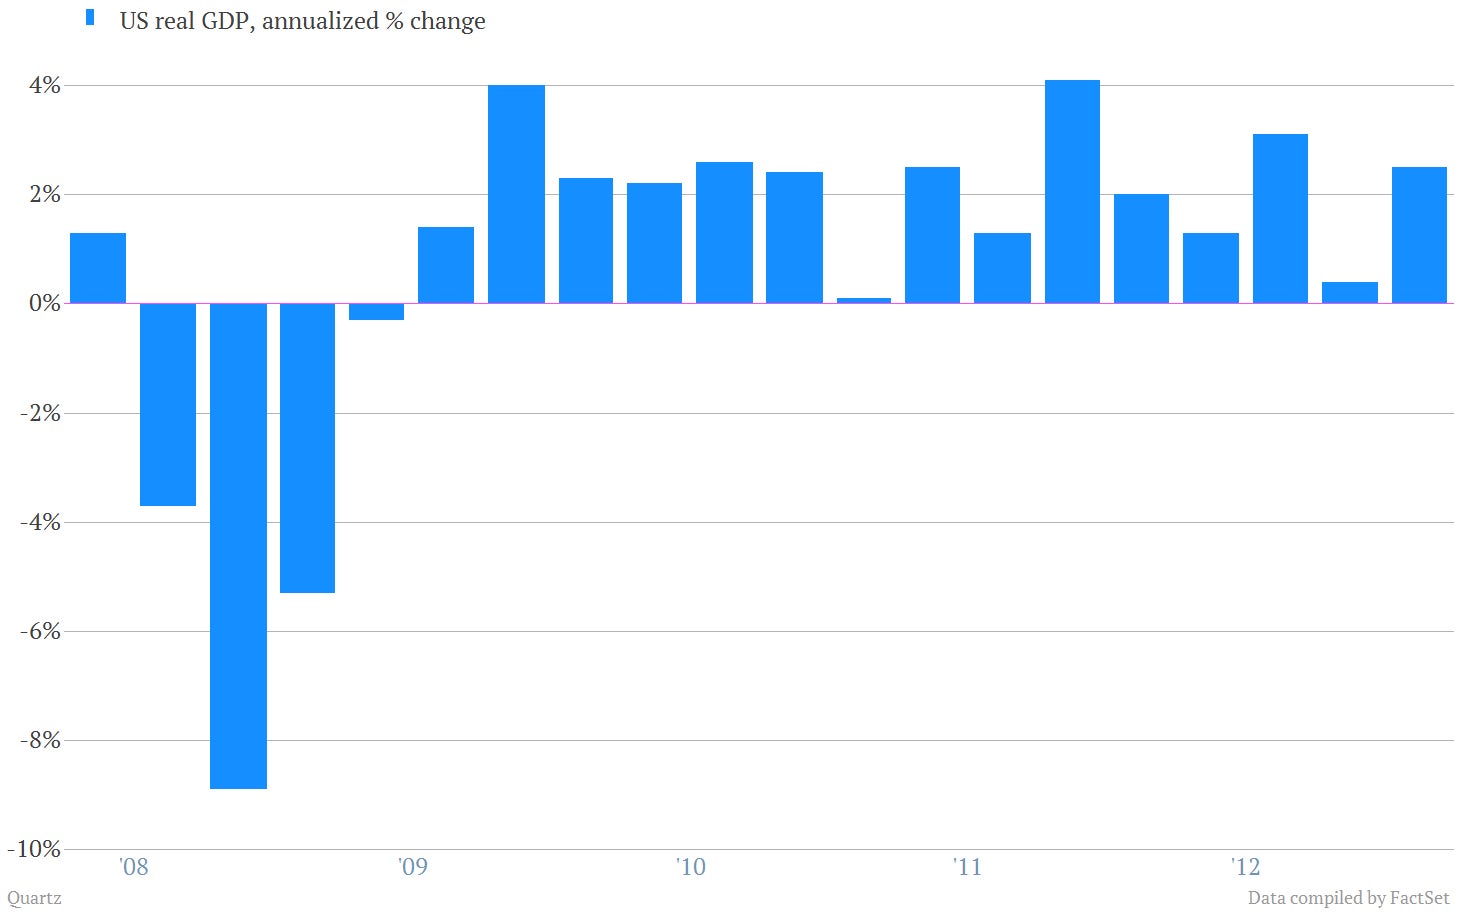
Decent. But the 2.5% annualized growth rate posted between January and March was slightly under Wall Street’s expectations of 3.2%. Here’s a look at the last five years of quarterly numbers.
Join 500,000+ readers who start their day with Quartz.
By subscribing, you agree to our Terms of Service and Privacy Policy.
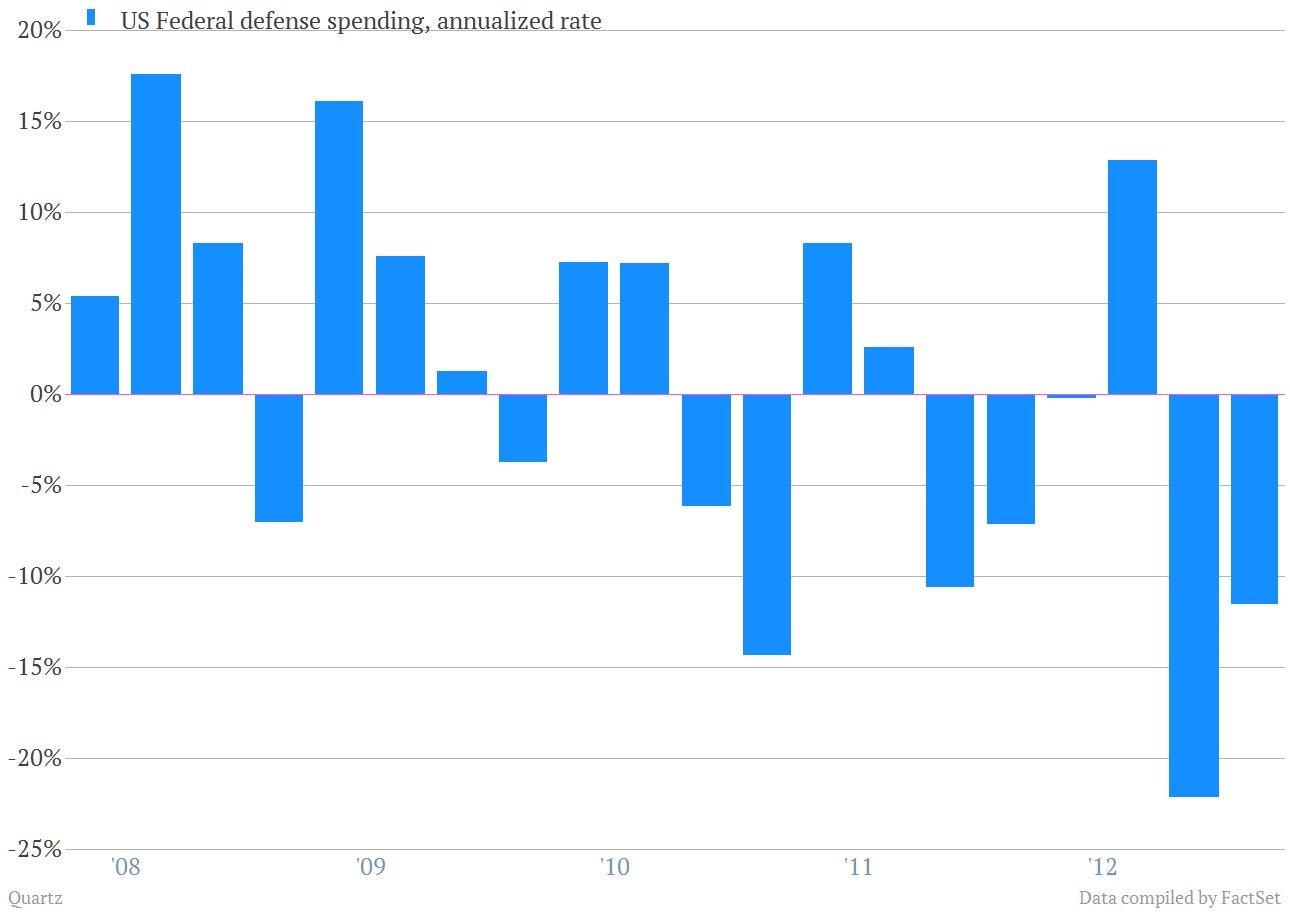
Government spending. As in all advanced economies, the government’s actions account for a substantial chunk of economic activity. And real government spending continues to drag on the overall economy. During the first quarter it continued to shrink at at annualized rate of 4%. Though that’s slightly less than the 7% shrinkage posted at the end of 2012.

A lot of that shrinkage was due to cuts in defense spending, part of the bigger US effort to reduce spending—known to the cognoscenti as “the sequester.”
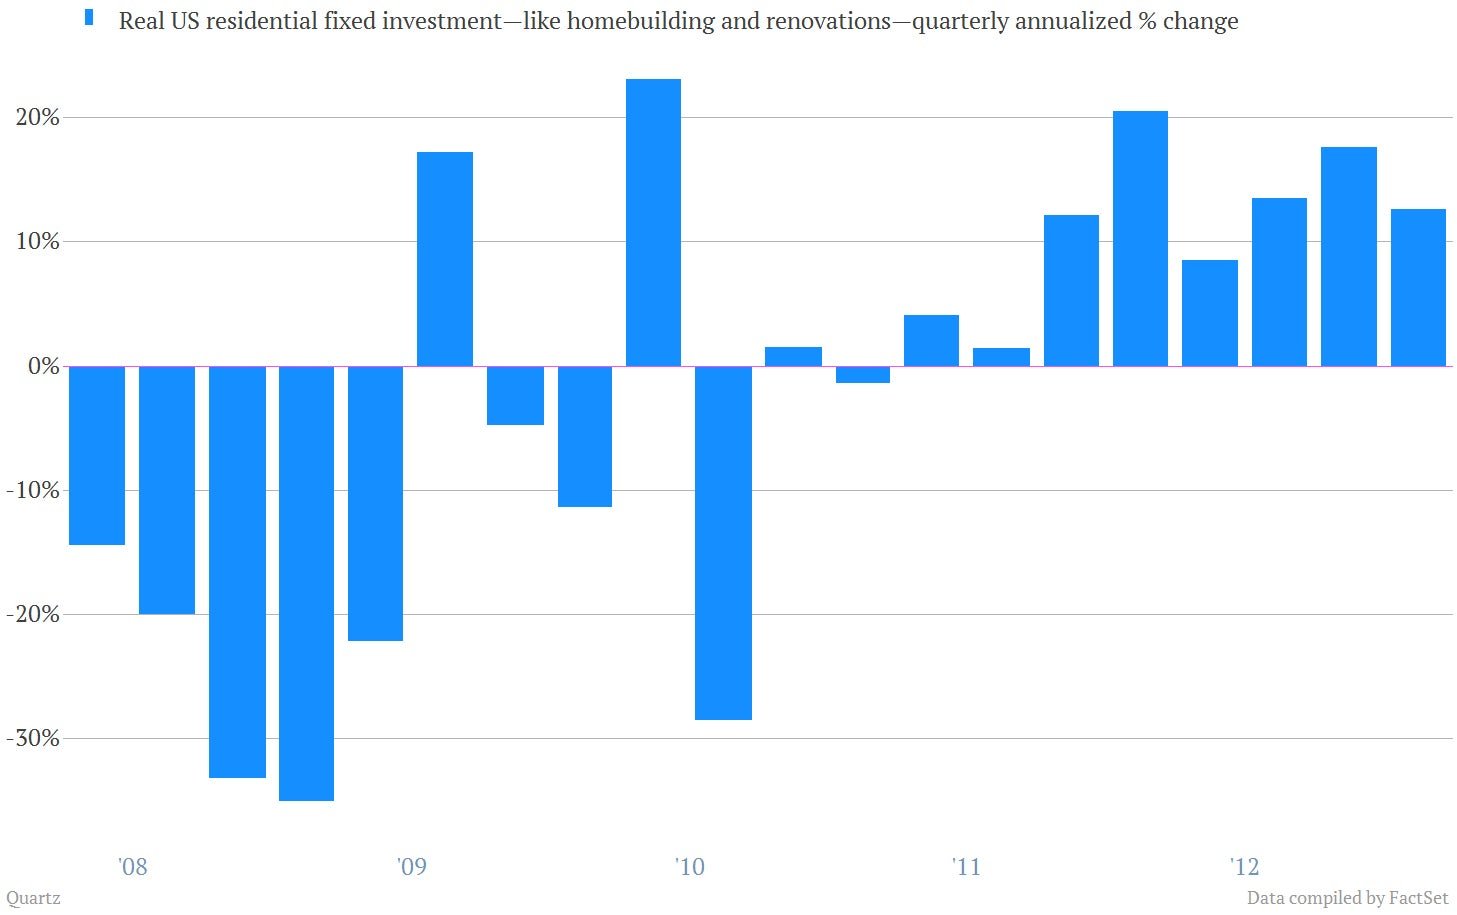
The US housing renaissance continues to help drive growth, rising 12.6% during the quarter.