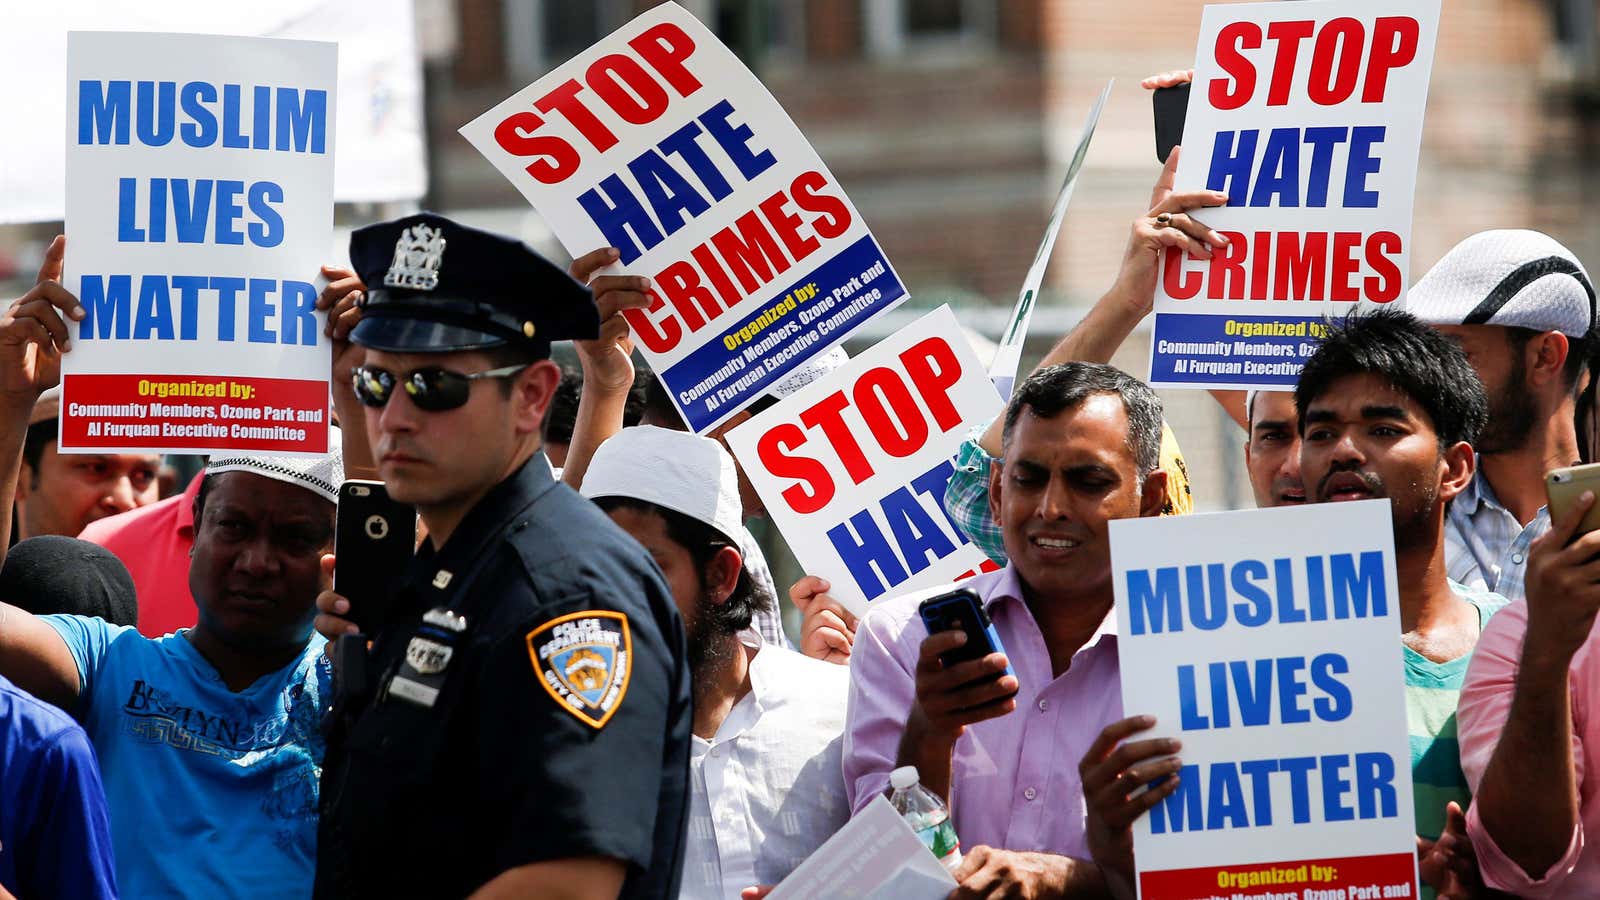
In the weeks since Donald Trump’s victory in the US election, there have been reports of hate crimes across the country, including racist graffiti, threatening fliers, and physical attacks. In response, a police unit focused on hate crime is being established in New York, and financier George Soros has announced plans to donate $10 million to fight what he sees as “dark forces that have been awakened.”
During an interview on 60 Minutes on November 14, Trump told the perpetrators to ”stop it,” but also wondered if the media was overstating the phenomenon, a question that persisted this week. Has there been an increase in hate crime in the US since the election? Or just an increase in the amount of media coverage those crimes have received? Perhaps there’s been an increase in victims reporting incidents on social media? All of those questions can be difficult to answer, especially for the country as a whole. Disparate local police departments report hate crimes differently, and some don’t report them at all.
So we’re left to look at what’s readily available. We examined the three sources of hate-crime information that have been cited the most frequently since the election: the Federal Bureau of Investigation, The Southern Poverty Law Center, and Shaun King’s hate-crime-mapping project. Together they paint a picture of a country unprepared to quantify discriminatory civil unrest.
There is a detailed assessment of each source below, but here are the key takeaways:
- There is no dataset that can tell us whether hate crimes have surged on a national level in the short span of time between the election and today. The government is simply not set up to collect and distribute that amount of information on a weekly basis.
- The latest national-level hate-crime data collected by the FBI only covers incidents up to 2015, and relies on local police departments to opt-in to reporting their statistics. Many don’t.
- The FBI dataset shows that hate crimes did increase by 6.8% from 2014 to 2015, largely driven by an increase in attacks on Muslims.
- Local governments and police departments, unlike the federal government and national advocacy groups, can track these kinds of trends in real time. As of this week in New York City, for example, there have been 31% more hate crimes in 2016 than at this time last year.
- Some frequently-cited sources are useful collections of anecdotes, but do not comprise long-term, normalized data that can be used to track granular trends.
Here’s a list of the sources we assessed, and what their data do and do not show:
The Federal Bureau of Investigation
How the data are collected: Local law-enforcement agencies have the option of sending information about hate crimes to the FBI each year.
The time period covered: On November 15, the agency released data for 2015. The FBI began its collection of hate-crime statistics in the 1990s.
What the data show: Hate crimes increased by 6.8% from 2014 to 2015, largely driven by an increase in attacks on Muslims. The motivation for 58.9% of the hate crimes in 2015 was race and ethnicity, and the victims of those crimes were distributed as follows:
What the data do not show: As the Associated Press reported last June and ProPublica pointed out last week, the data collection process is “deeply flawed”:
More than 3,000 state and local law enforcement agencies don’t report hate crimes to the FBI as part of its annual national survey of crime in America. Professor Brian Levin, who heads the Center for the Study of Hate and Extremism at California State University, San Bernardino, said the entire state of Hawaii fails to file any such reports.
And many of the law-enforcement agencies that do choose to participate do not appear to be particularly rigorous about documenting hate crimes and passing that information onto the federal authorities.
The Southern Poverty Law Center’s #ReportHate initiative
How the data are collected: After the election, the SPLC added a form to its website, asking the public to report hate crimes after they’ve reported them to law enforcement. The Center has also been collecting incidents from social media and news reports.
The time period covered: November 9, 2016 to the present
What the data show: As of November 18, the SPLC has found 701 ”incidents of hateful harassment” since Election Day.
What the data do not show: Although this collection has been cited as evidence of a “spike” in hate crimes since the election, the Center has not been collecting data for long enough to show any trends. The SPLC also pointed out in a recent blog post that while they’re making attempts to verify the incidents, they haven’t verified them all:
These incidents, aside from news reports, are largely anecdotal. The SPLC did follow up with a majority of user submissions in an effort to confirm reports. As we reported earlier, many incidents involved direct references to the Trump campaign and its slogans.
See also: The SPLC also maintains a larger dataset of more than 4,000 “hate incidents,” which is “drawn primarily from media sources.” The dataset contains incidents from January 2003 to May 2015, and includes non-criminal activity like rallies. This sort of data may provide some insight into how hate crimes and related incidents are covered by the media, but not in how frequently they occur.
Shaun King/Ushahidi
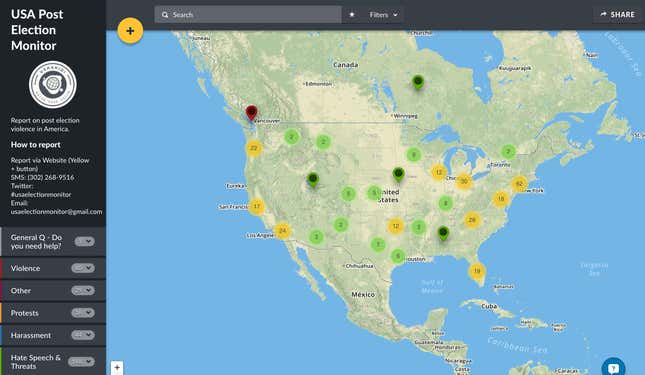
How the data are collected: The day after the election, activist and New York Daily News writer Shaun King began receiving hundreds of messages from people who said they witnessed or were victims of hate crimes. King and Ushahidi, a data analytics firm, began to “gather, sort, verify, and publish the many reports of hate crimes appearing post election in the USA,” and put them on a map.

The time period covered: November 9, 2016 to the present
What the data show: In a blog post published on November 18, Ushahidi said it found “300 reports of violence, hate speech, and harassment taking place in the past 10 days across the USA. There are 148 reports of hate speech or threats, 44 of harassment, 80 of violence. They cover the country, with large numbers in locations with large populations such as New York, Los Angeles, and Chicago. There are also a number in Florida, North Carolina, Texas, and throughout the rust belt.”
What the data do not show: Like the SPLC data above, this is a useful collection of anecdotes, but tells us little in terms of trends. The individual stories in collections like this are helpful in understanding the nature of hate crimes happening around the country, but not in drawing conclusions about geography, demographics or the rate of incidents.
Look to your local government
Although the federal government does not have an apparatus in place to report trends in hate crimes as they occur, many local governments and police departments do—all they have to do is look at their own records. In New York City, for example, police commissioner James O’Neill said in a recent radio interview that hate crimes are indeed on the rise.
“We’ve had an uptick in hate crimes—actually a little bit more than an uptick,” he said. “We’re up 31% from last year. We had at this time last year 250; this year we have 328. Specifically against the Muslim population in New York City, we went up from 12 to 25. And anti-Semitic is up, too, by 9% from 102 to 111.
“I have no scientific evidence as to why,” O’Neill added. “But you’ve been paying attention to what’s been going on in the country over the last year or so and the rhetoric has increased, and I think that might have something to do with it.”
