The US government can tell you a lot of things: how cruise ships rank in sanitation inspections, or which of its websites is most popular. And on the local level, in a place such as New York, you can find out every time a racehorse has been injured or dig through information on all the documented rat sightings.
But authorities can’t answer countless basic questions about the US criminal-justice system, from the number of people shot by police to exactly how many Americans have a criminal record. Officials looking at court data in their county may have no way to compare it to their neighbors. Worse, they often have no idea what’s going on in their own backyard. Comparing data on the national level is often impossible, since, as experts often say, there’s no one US criminal justice, there’s as many as the number of counties: more than 3,000.
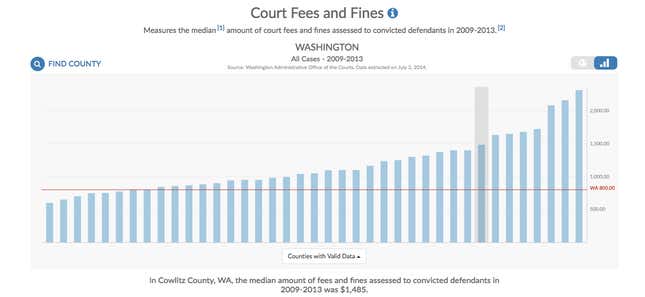
A new, wide-reaching data tool backed by both the US Department of Justice and Silicon Valley donors aims to fill in many of these gaping holes. The idea is that Americans should be able to find out whether a local jail is filled over capacity and how that compares to the next county over, or how the court fines imposed by their local government measure up to those in a different city:

“Our motto is ‘no data, no change,’” says Amy Bach, the founder of the non-profit behind the tool, Measures of Justice.
“You can’t change what you can’t see, so let’s start with trying to see,” she tells Quartz. “Not just what’s happening in Cook County, that everybody talks about, or Ferguson…. but how about Indiana County, Pennsylvania? Or Monroe County, Florida? You can now reach into the heart of America and ask ‘how are we doing?’”
The database is composed of 32 measures, from arrest to post-conviction, established by a group of experts, including the former heads of the statistics bureau of the Department of Justice. Each measure, which also includes how many people failed to pay a low bail amount and recidivism rates for jail and prison, can be broken down by “filters” such as age, sex, and offense. After the organization gathered information from local courts, the staff of criminologists and coders made sure data from different localities was comparable and built out an interactive portal.
So far, they’ve gathered information from six states—300 counties, representing 10% of the entire US. The aim is to continue increasing that number, with support from the Chan Zuckerberg Initiative, Google, and George Soros’ Open Society Foundations, among others. Measures for Justice is also planning to expand their efforts to police data, Bach says.
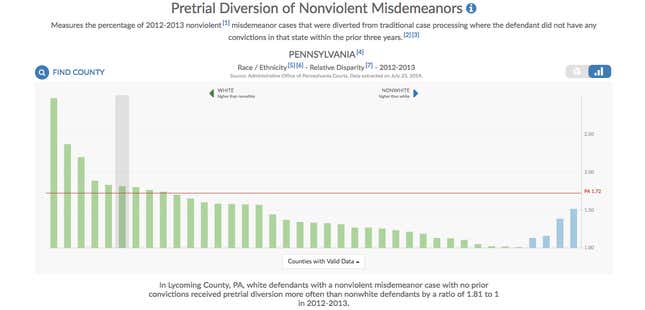
Here’s an example of how you can filter the data through the tool, if you want to find out, county-by-county, the disparity between whites and non-whites sent to pre-trial diversion instead of jail:

Bach started the project six years ago after writing a book in which she dove into everyday injustices in courtrooms around the country. What struck her was a certain lack of awareness among local attorneys. She described, for instance, how a public defender would have plead 48 clients plead guilty in a day and “think he’s done a fantastic job because speed equals success.”
“All of the practitioners had good intentions, but they had no idea that they were turning a blind eye to one of the main purposes of their jobs,” she says.
The project’s fundamental idea is that “justice happens on a local level.” The US mass-incarceration crisis on the “macro” level begins locally, “in a courthouse in Mississippi with a crumbling sidewalk,” says Bach, where defendants get sent to jail for low-level misdemeanors. “That’s where the accumulation begins, and that’s where people have to start the conversation…How are you supposed to know what you’re doing unless you have a mirror?”
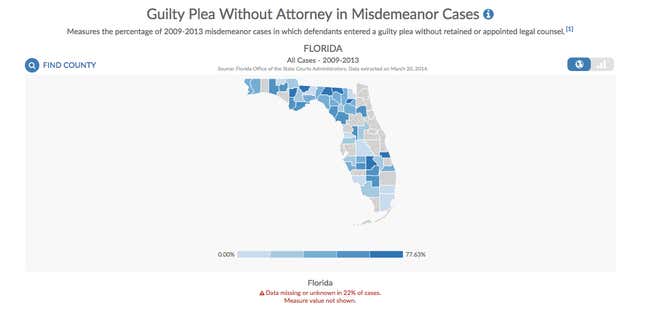
You can view the data you’re looking for as a bar chart, or as a map:

The tool is intended not just for the prosecutors, judges, and law enforcement officers working in the system. It’s also meant for academics, local elected officials, and ordinary civilians. Each measure is labeled in a technical manner, but also includes a detailed description of why you should care about that statistic. It’s also completely free.
