Uber thinks its data can solve Nairobi’s epic traffic jams
Nairobi’s residents like to complain that driving from the airport to the city center—a distance of only 17km (10 miles)—can sometimes take longer than traveling to a foreign country.


Nairobi’s residents like to complain that driving from the airport to the city center—a distance of only 17km (10 miles)—can sometimes take longer than traveling to a foreign country.
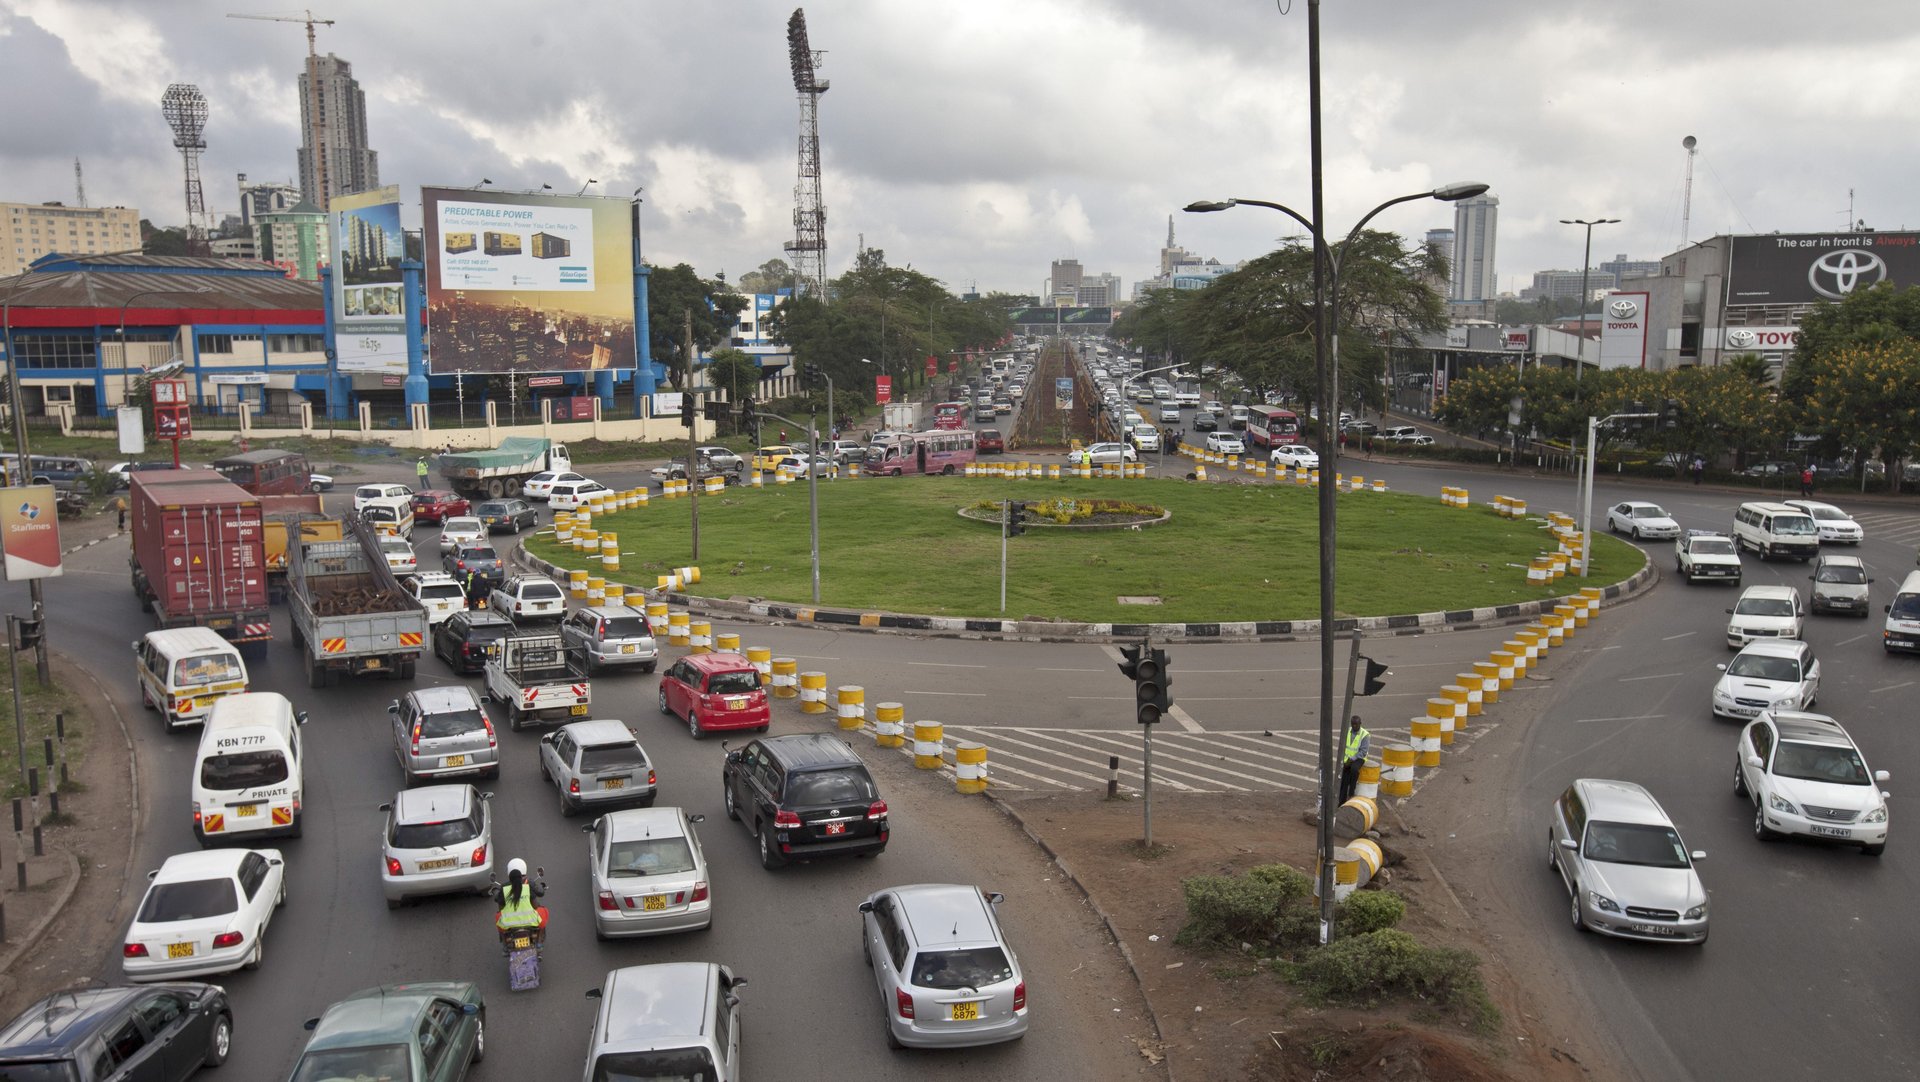
With more than 4.5 million people, traffic congestion in the Kenyan capital can be maddening, especially during peak hours. Rapid urbanization, a rise in the number of car owners, poor infrastructure, and an ad-hoc system of colorful matatu busses are jamming up the city’s streets, making them dirtier and deadlier than ever before.
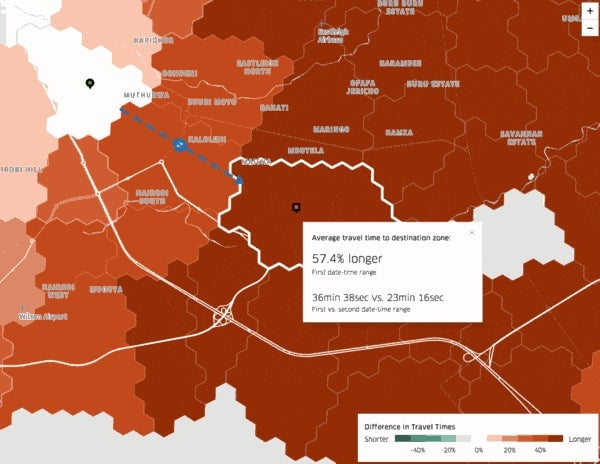
Uber wants city officials, urban planners, and researchers to use its data to solve some of these challenges. In 2017, the San Francisco-based ride-hailing firm launched Movement, a free tool that provides users with traffic insights from cities where the company operates. The Movement tool is already available in Nairobi, as well as Cairo, Cape Town, Johannesburg, and Pretoria.
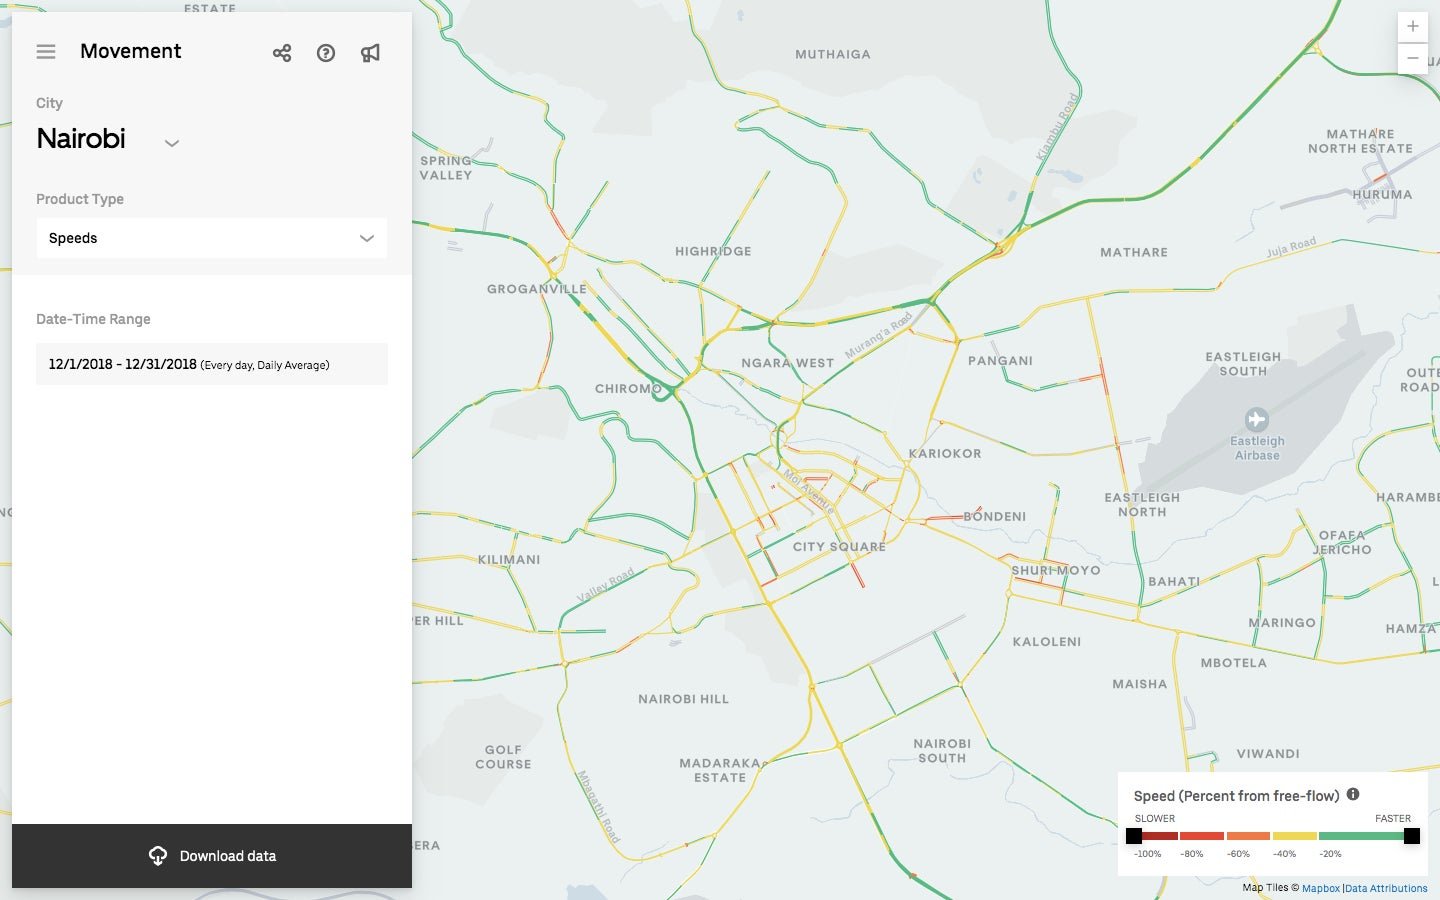
It’s now followed up with more detailed data from Uber Movement Speeds, a platform which is currently only being rolled out in Nairobi, New York City, Seattle, Cincinnati, and London. It allows policymakers to track vehicle speed and review street-level data on an hourly, daily, and weekly basis to gain insight on how to manage congestion, reduce vehicle usage and parking, and design safer streets.
Uber has used African cities as a testing ground for other experiments, such as offering cash as a payment option in Kenya, running its first ever bus service in Egypt, and experimenting with local modes of transportation, like boda-boda motorcycles, in Uganda and Tanzania. The firm operates in 22 African cities, and has over 1.3 million riders and tens of thousands of drivers in the sub-Saharan African region alone. It has a vested interested in moving customers quickly through traffic-clogged streets.

The Movement Speeds project hints at the immense trove of transit data the e-hailing company collects on a daily basis. Uber’s drivers complete an average of 17 million trips per day worldwide across 700 cities. Given the breadth of its operations, the company has had to address how much it and other ride-hailing services, like competitor Lyft, are contributing to traffic congestion, in addition to its regulatory tussles with government officials and drivers.
The company says the tool is already being used to assess the effect of congestion pricing in New York and the validity of traffic models in California, as well as by the US Department of Transportation to identify potentially unsafe intersections. “We hope to develop similar use cases for Nairobi now that the data is available,” Uber’s head of policy for East Africa, Cezanne Maherali, says.

Movement Speeds is also an indication of what data Uber is willing to share with local governments. The ride-sharing firm has received requests from authorities in some countries demanding to know more about riders and drivers. In Egypt, one of Uber’s fastest growing markets, officials have reportedly requested access to user information—a worrying move in an increasingly repressive regime.
Maherali says Movement Speeds “will only be able to look at aggregated travel time and speed data,” and that the tool will not disclose individual rider or driver data.
Analysis by Uber of Speeds data has already shown how significantly traffic congestion impacts Nairobi, particularly in the central business district during rush hours. The bigger challenge will be how well—or even whether at all—authorities will use the data to try tackle Nairobi’s infrastructure and urban mobility issues. Without their buy-in, the platform could prove tangential to solving the city’s annoying snarl-ups.