Popular discourse on the topic of private equity (PE) exits in India has always been confusing. Headlines like “Investors cheer: Private equity exits hit all-time high in 2015” and, the more sobering “PE exits near four-year lows” have appeared within weeks of each other.
For years, private equity professionals in India sought to establish credibility with “How much money we put to work.” In recent times, the narrative shifted to, “How much of the fund we returned to investors.” The journey between the two statements tells the story of a maturing industry urgently developing its approach to exits in a large and volatile emerging market.
Solid data from exits over the past decade provides a more accurate picture.
The PE exit record in India is among the primary concerns, for both limited and general partners.
The long view: between 2000 and 2013, of the $94 billion invested, $24 billion (on a cost-basis) exited at a value of $43.5 billion, or a 1.8 return multiple. Of the $70 billion that remains invested, as much as $33 billion was invested between 2000 and 2008. The number could be lower, since it is difficult to know how much is written down.
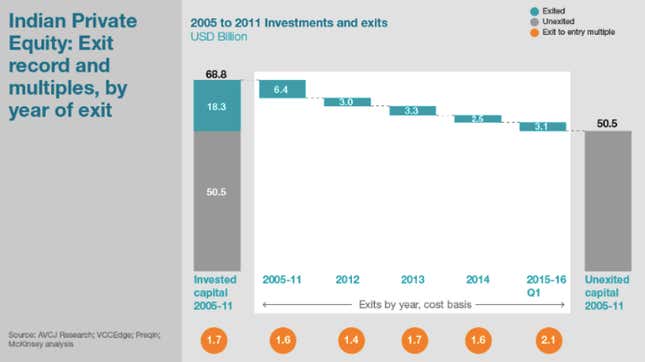
More recently, between 2005 and 2011, private equity invested $69 billion, of which $18 billion exited at a value of $31 billion, or a 1.7 return multiple.

Here are some of the questions we’re often asked.
Is the exit record improving?
The good news is that returns are indeed improving. Exit multiples are on the rise: from 1.6-1.7 times in 2013-14 to 2.1 times in 2015-16. We see a corresponding improvement in IRRs (internal rates of return). Gross returns at exit have risen to 18% in the first quarter of 2016, from 9% in 2014 (and 14% in 2015).
However, the pace of exits remains stubbornly consistent. For the 12 quarters from 2012 to 2014, an average of $730 million (at cost) exited per quarter. For the five quarters from 2015 to the first quarter of 2016, that number stood at $620 million—slightly lower than the average in the earlier years.
In short, the exit record for recent vintages investments is improving while earlier vintages remain stubbornly stuck.
Is there a pattern to successful exits?
Our analyses of exits reveal some compelling themes. PE firms that initiated strategic and operational improvement programs in their investee companies within the first 12 months were more likely to exit. Early improvements allowed funds to exit as soon as opportunities presented themselves. As returns improved between 2013 and 2015, we saw average exit periods correspondingly reduce from 5.9 years to 4.4 years.
In general, the shorter the holding period, the better the returns.
Is there genuine outperformance prior to exit?
We measured the performance of PE portfolio companies relative to non-PE-backed peers (adjusted for size and sector). Our analysis shows clear outperformance, both in revenue and earnings growth. Equally important, we can attribute much of this improvement to specific actions taken by new investors, promoters, board, and management.
On an average, improvements in margin are easier to sustain compared to revenue. However, there is an important flipside—gains are highest in the first few years, and diminish over five years.
How have exits fared across sectors?
We analyzed 880 exits across 11 sectors. Unsurprisingly, the exit and return record varies significantly, depending on the sector. If we apply a simple bar and choose sectors that returned at least one-third of the capital invested, at an IRR higher than 14%, three sectors meet the bar: IT/BPO services, financial services, and healthcare.
While engineering & construction, consumer goods, and machinery & industrial goods meet the 14%-returns hurdle, less than a third of the deals by value have exited these businesses. On the other hand, telecommunications and transportation & logistics exited more than a third of the capital invested, but did not meet the 14%-return hurdle.
On balance, sectors that offer natural liquidity by virtue of their profitability or ability to raise cash, are less susceptible to having exits and/or returns impacted by volatility.
This post first appeared on LinkedIn.
