It’s human to want to get better at what we do, not just at work but in life, and to ask questions such as:
I started my journey of self-tracking and continuous improvement in the beginning of 2017 to answer these questions and more.
I knew it would be too hard to track everything manually, and the amount of time spent generating metrics compared to actually getting better concerned me. With that in mind, I looked for apps and tools to help streamline my “self-quantifying”.
The result is a portfolio of tracking apps that work largely in the background of my life, or via habit at this point, collecting data to create a fairly comprehensive overview of how I actually spend my time, not how I think I spend my time.
(You can see my 2017 Year in Review to get an idea of just how comprehensive it gets.)
This article reviews all the apps I landed on to track my metrics and covers how you can use each to gain insights that actually help you optimize and improve. Experiment with the ones that resonate most with your lifestyle, gadgets, and goals.
An important side note: One of my criteria was to use only free apps, but you should keep in mind that when you’re using something for free, you are the product (though that often happens when you’re paying as well). Before signing up for these apps, be sure you’re ok with their data sharing and privacy policies. I’ve decided I’m comfortable giving data to these particular companies, but that’s a personal choice.
In the last few years, I discovered audiobooks for real and drastically increased the number of books I read each year. I use Goodreads to keep track of which books I’ve read and when. It encourages me to take notes when reading so I can write a decent review when I finish. It’s also a great way to find new books to read.
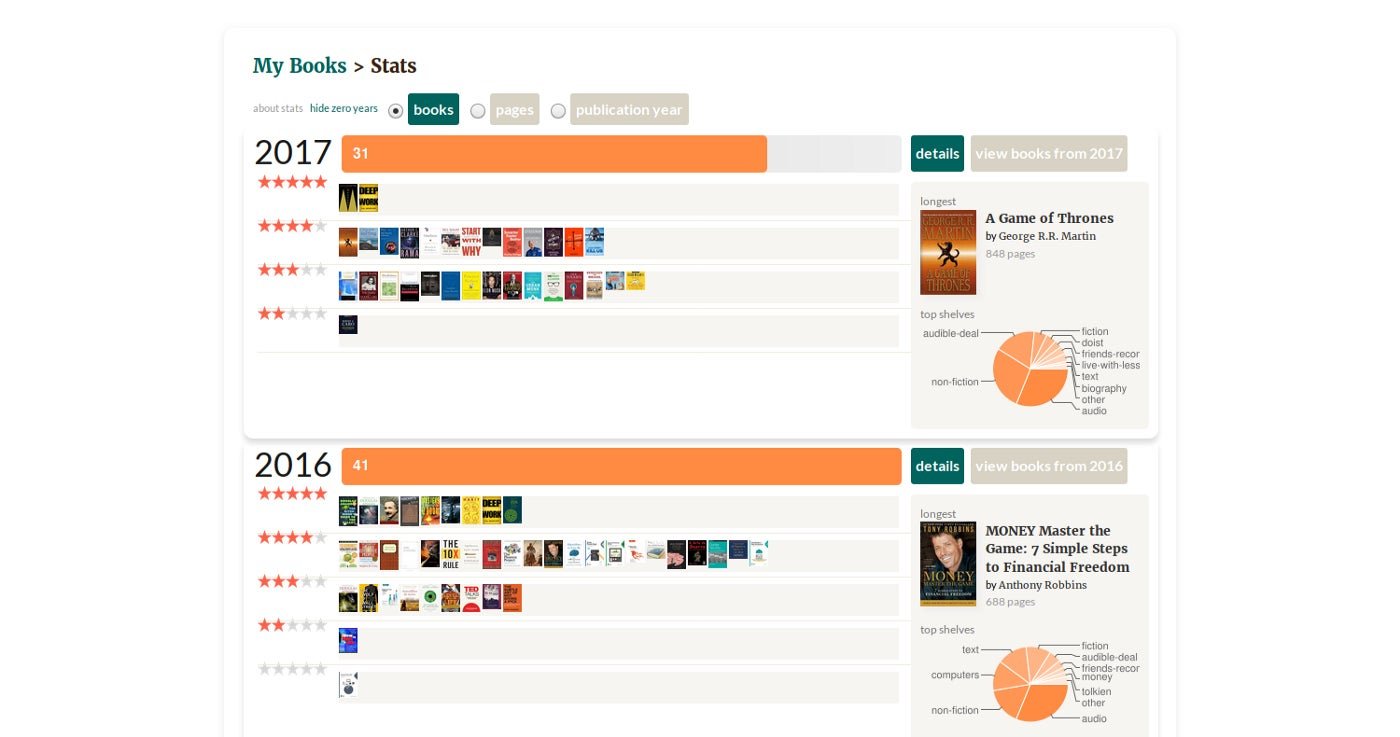
By using Goodreads, I can generate reports like this:
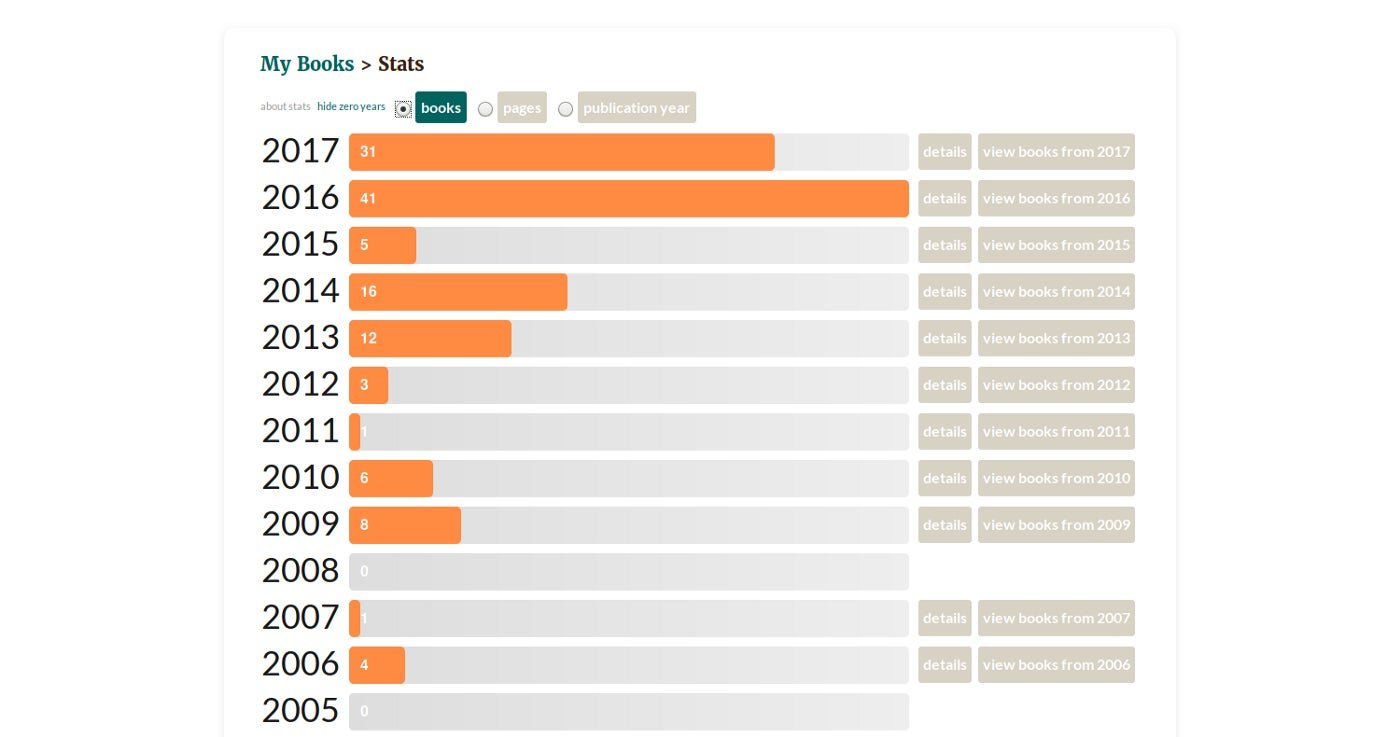
This report tells me exactly how much audiobooks changed my reading habits. (I highly recommend you to try it.) Goodreads also provides a breakdown by year:
The yearly report helps you understand if you’re picking the right books. If your rating is not consistently high, you may want to change the way you’re finding the next book.
I can also go back and read my reviews to remember what my takeaways were. What good does reading do if you don’t remember what you learned?
If you check the Goodreads report by year, you may notice I read many fewer books before 2016. Why wasn’t I improving? I knew I was reading a lot, just not books, so I decided to track how many articles I read every month.
My first idea was to use Todoist —an app made by the company where I now work — to track my reading list. It was working ok, but I had three problems with my method:
A friend recommended I try Pocket. It integrates with many platforms and works like a “read it later” app, fixing problem #2.
It also extracts the content from the webpage and gives you an interface to read that you can customize to your own needs, fixing problem #3.
That still left problem #1. I couldn’t find any good app to extract data from Pocket, so I had to deal with it myself.
The Developer Solution
I’m a developer, so I built what I needed to get the results I wanted based on their export an HTML file feature. I just download their file and run this code:
var pocket = {“unread”:1420,”unread_pct”:4.79,”read”:1020,”read_pct”:1.18}
var uls=document.body.getElementsByTagName(“ul”);unread=uls[0].children.length,pocket.unread_pct=+(100*(1-pocket.unread/unread)).toFixed(2),pocket.unread=unread,read=uls[1].children.length,pocket.read_pct=+(100*(1-pocket.read/read)).toFixed(2),pocket.read=uls[1].children.length,console.log(JSON.stringify(pocket));
The first line is the result of the previous month, which looks like this:
{“unread”:1446,”unread_pct”:1.8,”read”:1050,”read_pct”:2.86}
In this case, I have 1446 articles unread and 1050 read. The percentage of items increased by 1.8% for unread and 2.86% for items read. For this particular month, I read 30 articles, which is the difference between last month (“read”:1020) and this month (“read”:1050).
The Non-Developer Solution
When writing this article, it became clear that this method is not accessible for a lot of people. I decided to think about a non-developers solution. Thanks to the editor of my company’s blog, Becky, I’m prototyping a simple process using IFTTT + Pocket.
I created a public applet that links Pocket to Google $GOOGL Spreadsheets. Unfortunately, Pocket doesn’t have a field for the archived date, so I’m using tags to track the month I read the article. The result will look something like this:

The D column is related to the time this article was added to Pocket. I decided to keep it so I can easily see the time from added to read. It’s not very elegant to have to add a tag every time I read an article, but it seems to work ok.
Now that we have the spreadsheet, it becomes straightforward to retrieve the data we want. The monthly date tags in column A are numbers, making the articles easy to sort and count. I still don’t have charts for this data but they’ll be easy to build in Google Sheets depending on the trends I want to track.
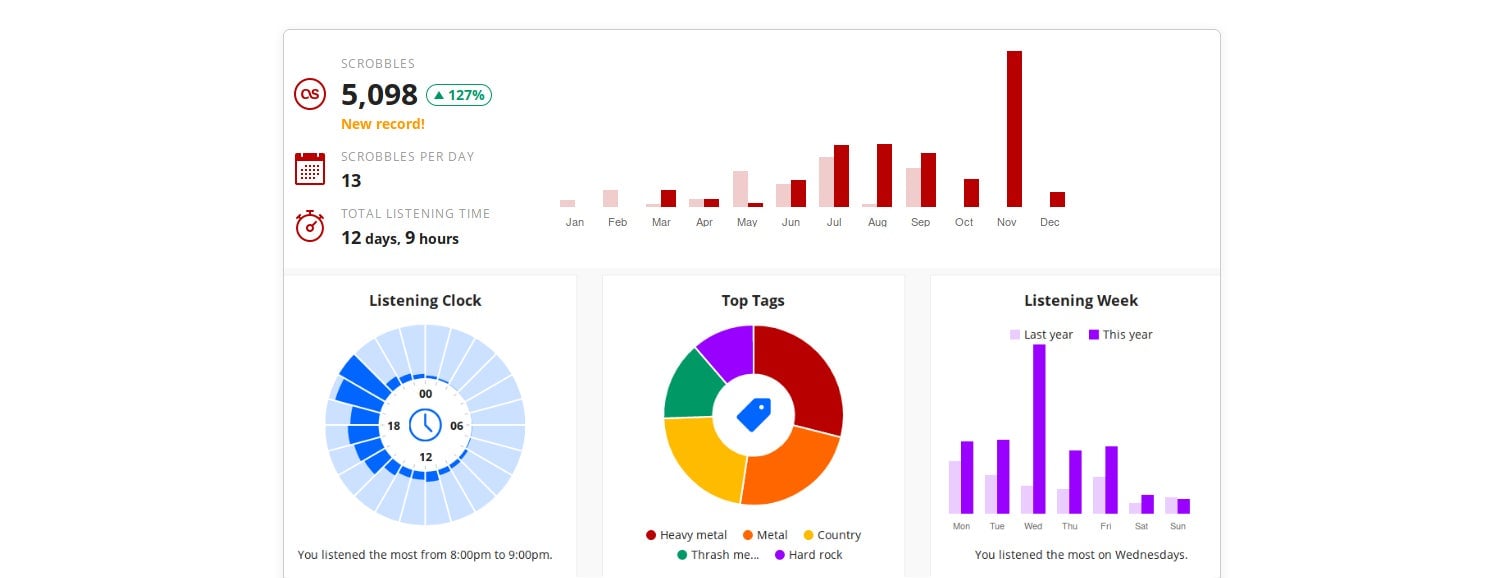
When I’m working, I usually listen to music. Sometimes I use it to energize myself and sometimes to help me concentrate. I use last.fm which gives me reports on what I’m listening to at which times. It’s even possible to correlate the songs to your most productive time if you want. You can do it manually or use a self-data aggregation tool like Exist.io.
Last.fm usually sends yearly reports as well, and they are fabulous:
Both apps provide statistics on your listening time. For Podcast Addict, you will have something like this under settings > stats:

Unfortunately the apps don’t make the data easy to extract. When I added up all the months to write my year in review, I had to do it manually. In general, it’s enough for you to think about the amount of content you’re consuming and how much it’s contributing to your personal development.
I try to avoid watching TV casually (by casually I mean aimlessly: sit on the couch and flip through channels looking for something), but I do follow many TV shows. I usually find the TV shows I like beforehand and reserve time to watch it with my family. As this consumes some time, I obviously want to track it (you may be seeing a pattern here).
I use TV Time to track all the shows I watch. It’s still a manual entry process — I have to remember to go to the app and mark as watched — but it became a habit pretty quickly. Every time I watch a great episode, I see funny memes in the app so there’s an immediate reward.
Of course, the longer-term reward is seeing my monthly/all-time stats:
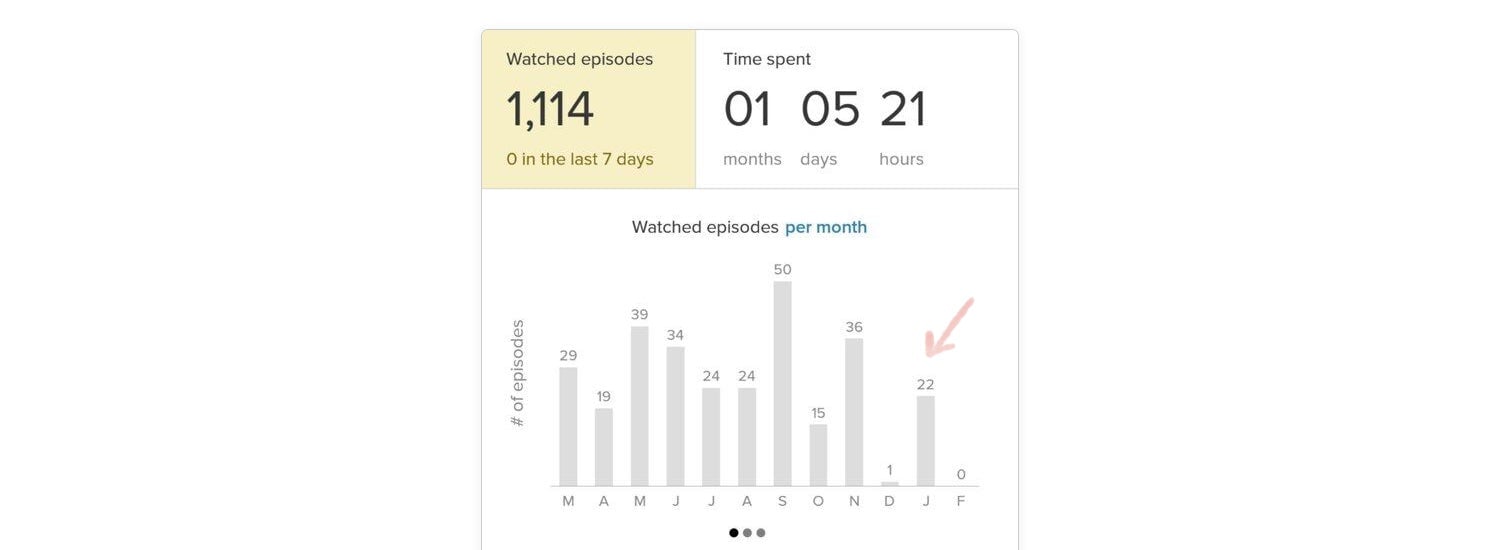
It’s OK to watch your favorite shows, just keep in mind the amount of time you’re investing in it and give it some thought. Is it worth it? It’s up to you to decide. In my case, it’s worth the time. My wife and I enjoy the time spent together and of course there’s all the post-episode analyses and future-episode hypotheses that are fun to discuss.
The only feature I miss from TV Time is movies tracking. For this reason, I decided to also try trakt.tv so I can track both.
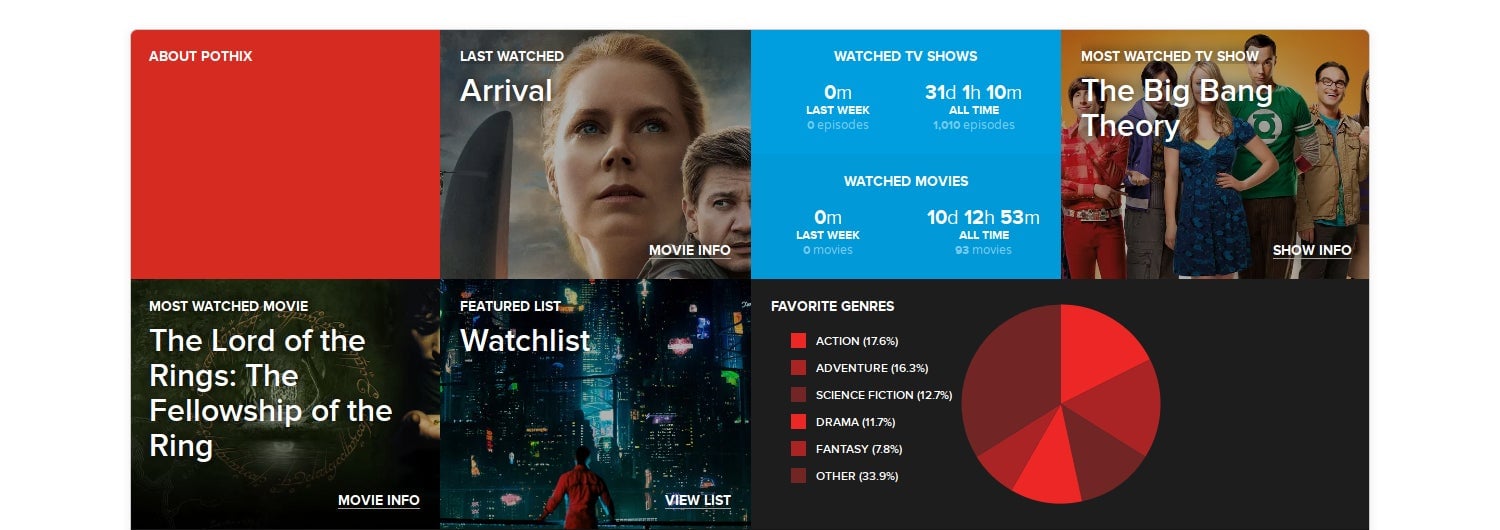
It would be nice to have some sort of integration between trakt.tv and tvtime, but unfortunately it doesn’t exist. TV Time has a great Android app, but doesn’t support movies. Trakt.tv supports movies, but you have to use other community-developed apps to track and send your stats there. So for now, I’m using both.
With auto-tracking applications, you can just set them up and forget about them. The app runs in the background and keeps track of what you’re doing and how much time you spend doing it. For this category, I use RescueTime configured to my own needs.
You can customize the times of day the app records your computer usage and/or which applications it will watch. For example, you can tell RescueTime to only to track how much time you spend in Excel and ignore all other apps if you so choose.
I use it to track many applications. These are the results I automatically get from just one day of work without any extra effort on my part:
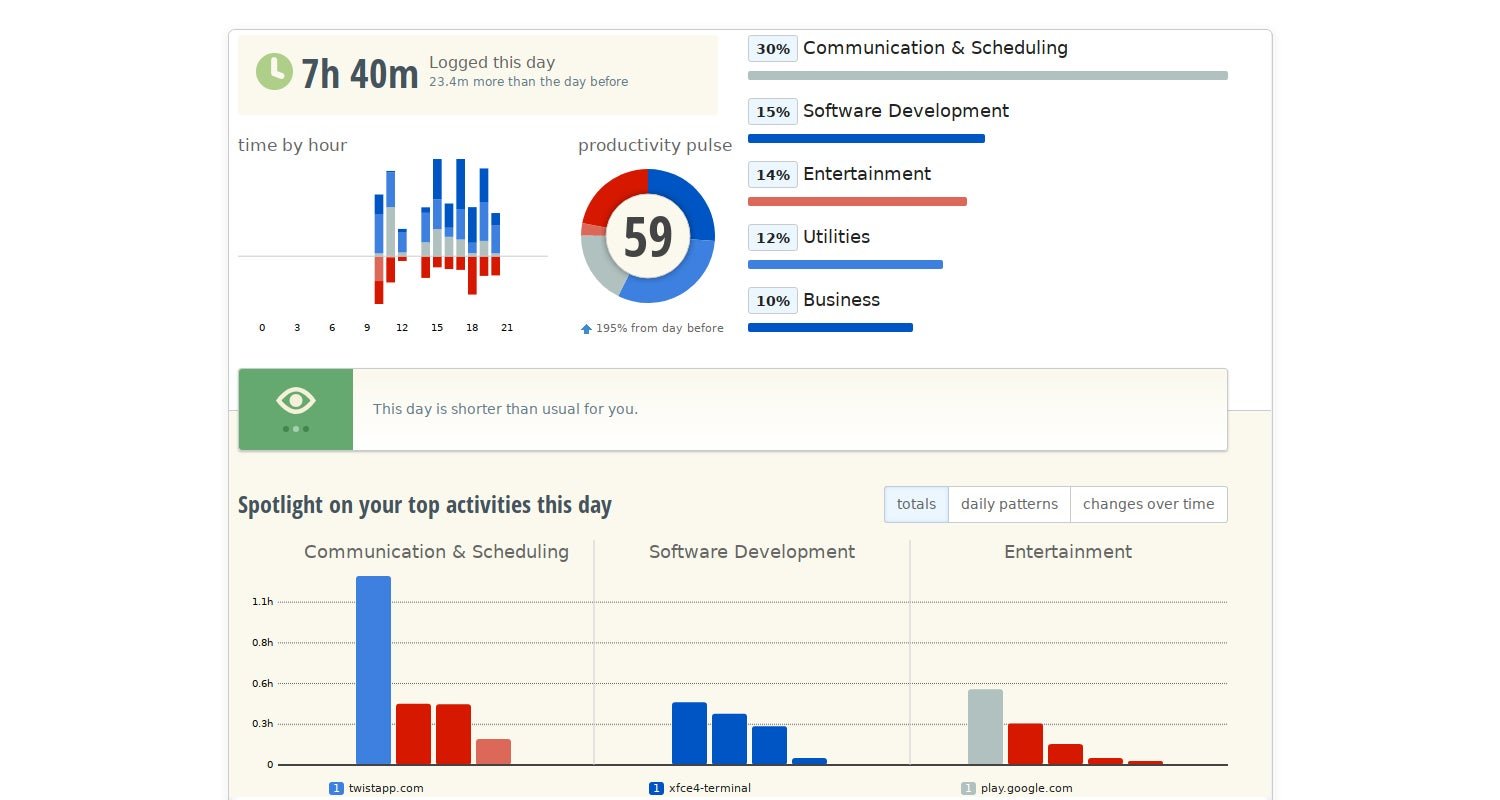
I often get valuable insights from these reports on better ways to spend my time. For example, I can take a look at each category of app and ask myself whether those activities warrant the amount of time I spent at the time of day I spent it. (I would recommend the book When to understand why the timing of your activities matters.) Over time, I can use this data to optimize my schedule for my energy levels, among other factors.
Unfortunately, auto-tracking can only take you so far. Knowing total time spent responding to emails is great, but which client were they for? Were they work emails or personal emails? The same goes for almost every application you may track. Manual time trackers demand action from you, like starting a timer and selecting a category — but once you make it a habit it takes minimal extra time.
For manual time tracking, I’m a huge fan of Toggl. It has a friendly interface, is easy to use, has many integrations (including one for the Todoist web app), and apps for many platforms (including Linux).
I created a streamlined Toggl system for clients, categories, and projects to make it easy to extract the reports I’m interested in while minimizing the bureaucracy added to my daily activities.
Some examples of my “clients” and their projects:
The three top-level categories separate the reporting between my day job, professional life, and my side projects. I track time spent in meetings so I can evaluate if it was worth the results or not. If I find it’s not time well spent, I can discuss it with my team and strategize to make some meetings more useful or eliminate others entirely.
I decided to keep just a few projects under the “Doist” client to reduce the cognitive load required to choose the project I’m currently working on. There’s always a trade-off between wanting more precise data and keeping self-tracking from taking over your life.
I use the “Deep work” project when I’m focused deeply on just one task, and there are no distractions — turn the cell phone off, close instant messaging, etc. (coding for example) and “Shallow work” project when I’m doing something that doesn’t require laser focus (responding to things on Twist, our team’s asynchronous communication app, doing project admin, etc).
(If you don’t know the concepts deep work and shallow work, I would recommend the book Deep Work by Cal Newport.)
I work remotely 99.99% of the time. Tracking time in Toggl helps me to understand if it’s time to stop or if I have more work to do. I try to keep my workday at eight hours. Tracking that time makes me plan my day more intentionally and work smarter to make sure I can get everything done.
This is an example of one week in Toggl reports:
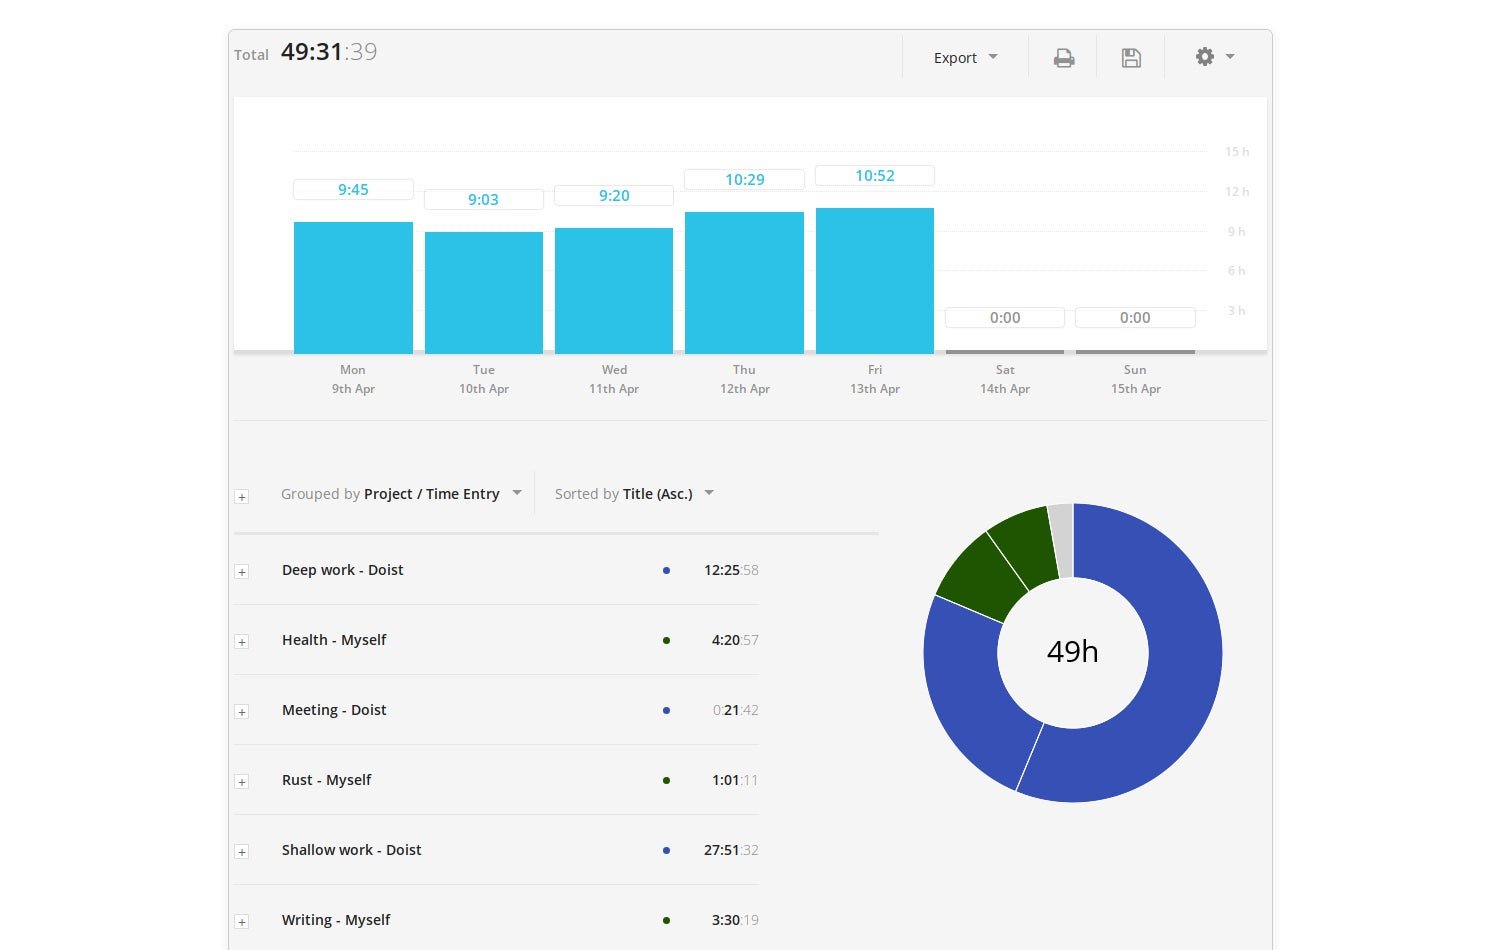
Remember: Manual tracking takes time and you don’t have to track everything. Track what is essential for you!
I’ve been tracking my location for some time now. I was a user of Google Latitude until it was retired and now I’m using Google Timeline. I usually don’t share much about my location on social networks or other places, but I like the benefits to track the places I visited.
Monthly, Google sends a newsletter with a summary of your location data:
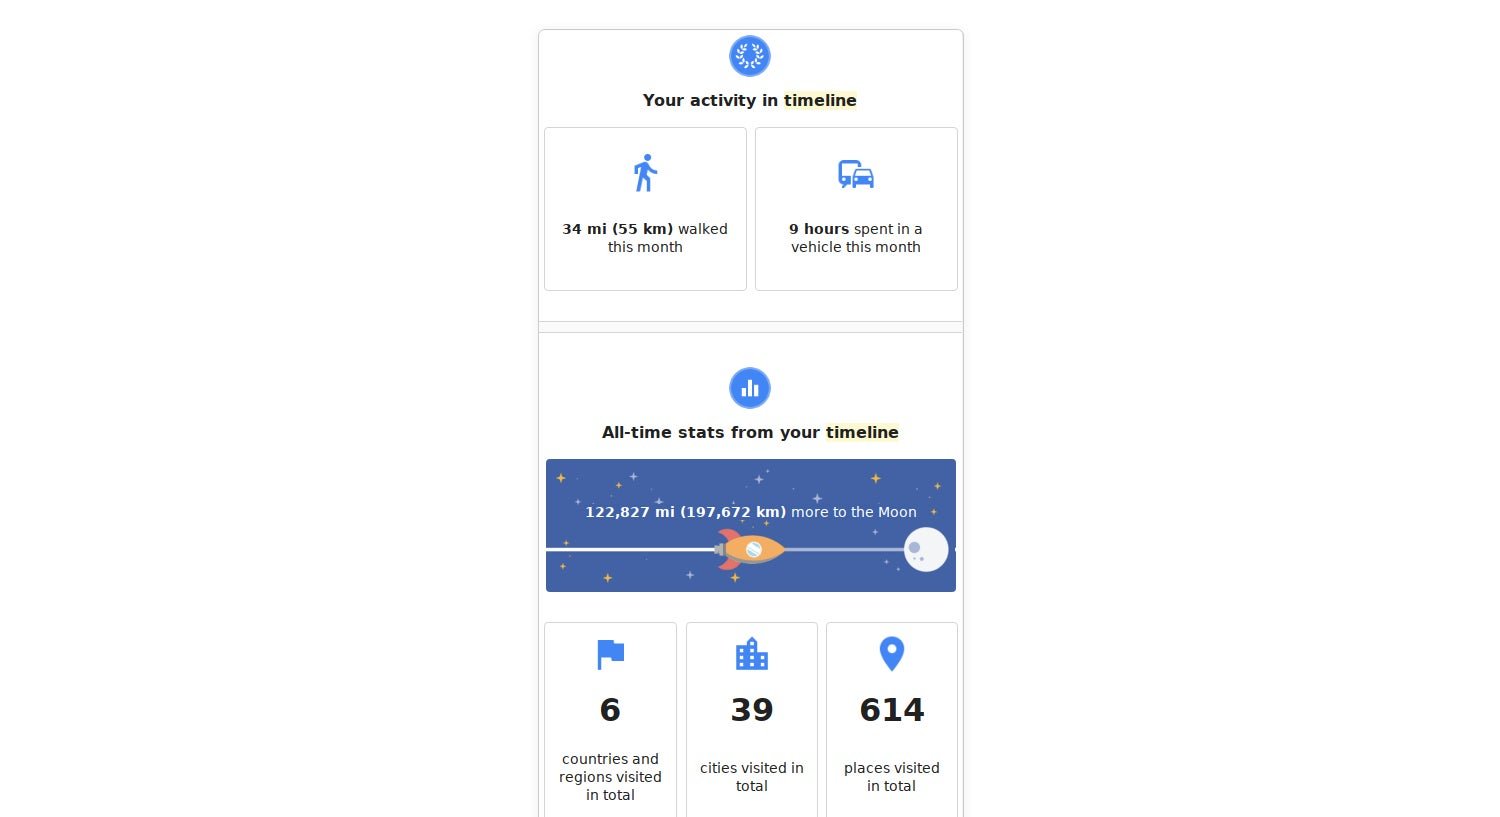
The time spent in a vehicle was particularly good for me to understand the time commuting when I was working in the office. It’s really nice to see my time spent in a vehicle after working remotely.
I can’t extract that much information to correlate with my location data, but it’s nice to be able to see the places I visited in the past, especially when I’m traveling.
It may seem a bit biased, but in my defense, I’ve been a Todoist user since almost the very beginning — 2007 to be exact — a full decade before I started working for Doist in 2017.

The main reason I applied for the position of API & Integrations developer is because I love the product and the company values. I’ve tried many task lists over that 10-years period, but always decided to come back to Todoist because it’s everything I needed.
Todoist has a (recently revamped) productivity view where you can see high-level stats on what you completed when. I’m not a big fan of keeping my daily and weekly task goal streaks (though if you are, you can change them to take it easier or challenge yourself more if you like), but I do like to see the big picture in the weekly view every month:

This report shows how I’m splitting my tasks during the week by project. The red bar is related to personal tasks, and the blue is for work. I usually have many small personal tasks related to my daily routine, and my work tasks are mostly big and deserve deep work. To make this view more useful, make sure you color-code projects by the high-level categories you want to track.
Reports like this combined with the ones provided by Toggl and RescueTime make me wonder if I’m spending too much time reading my Twist threads.
I’m a morning person and I usually spend more time than I should reading Twist in the morning when I should be doing deep work. The plan is to skim my threads in the morning and turn conversations I need to follow up on into Todoist tasks directly from the app so I can tackle them in the afternoon. (Keeping my Twist unreads at zero makes me feel better and I can prioritize follow-ups much better in Todoist.)
With this data, I can reach some conclusions based on trends I hadn’t noticed before.
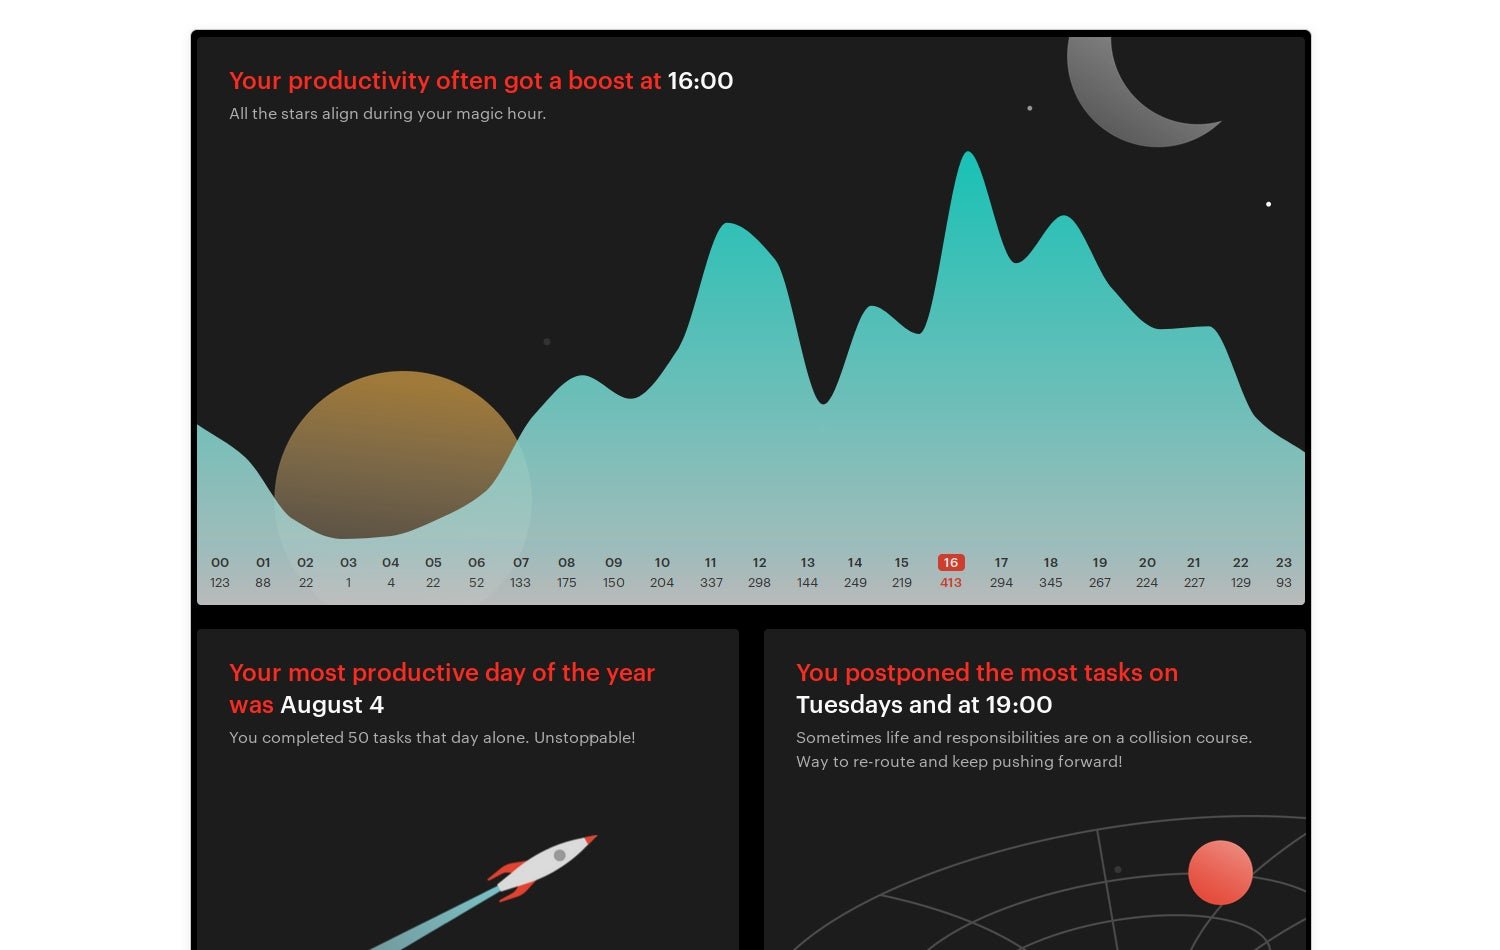
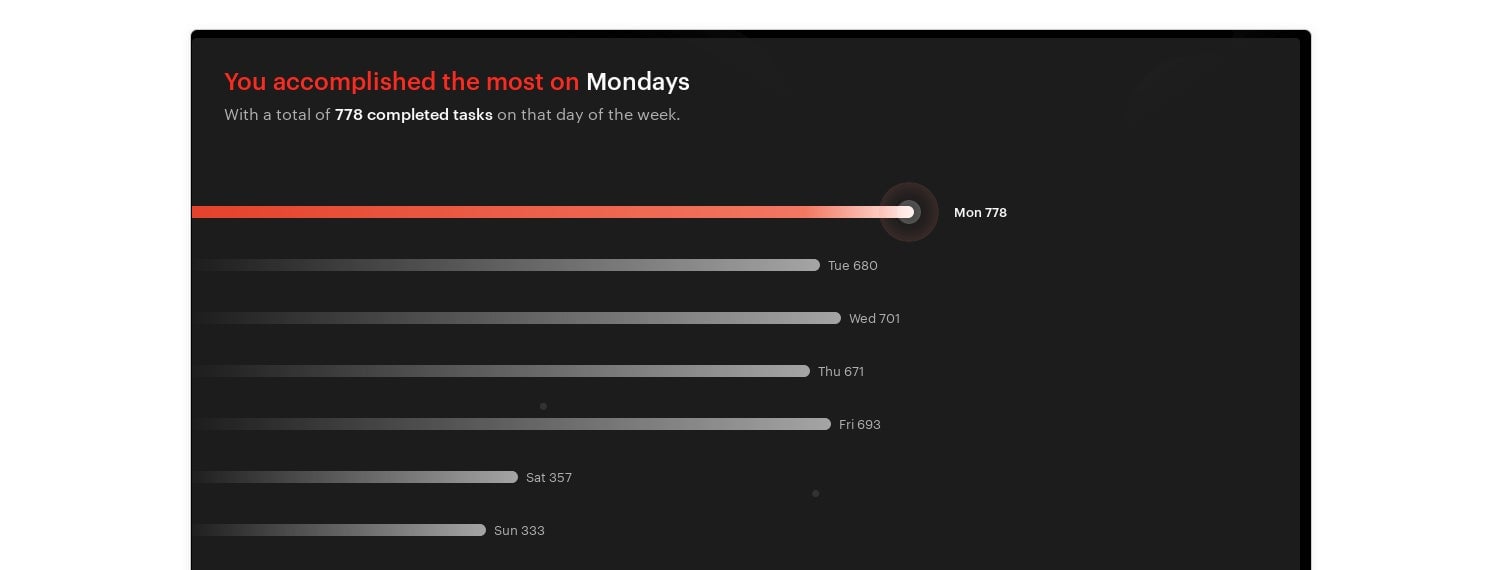
It’s also worth mentioning that Todoist’s annual Year in Review that they send out every January is not only entertaining but also packed with useful personal insights:
For this category there are a lot of trackers out there. Most of them are wearable devices you can pay some (sometimes a lot) of money for, and they’ll track various things as you go about your day. You can buy them, but you can also keep it simple and do part of this it for free or spend just the minimum.
Yes, I know steps are not a perfect metric of how healthy or active you are, but walking is a healthy thing to do. If you, like me, care about how much you’re walking every day, Google Fit may be a good app for you.
Google Fit tracks your steps, distance, and tries to guess the physical exercise you’re doing (not too successfully on that last item at the moment though). It’s quite simple; you just install it and keep your cell phone with you.
You can get monthly reports like the following on fit.google.com:

In my case, I had help to track my steps with a $30 band (more on that below) which can also track your sleep…
There are mobile apps to track your sleep, but, personally, I don’t like to sleep close to my cell phone. For this reason, I decided to buy a band to track my sleep patterns in addition to making my step count more accurate.
You can find dozens of bands out there, from tens to hundreds of dollars. I picked one that wasn’t too expensive and good enough for my needs — the mi-band 2 — but any of them will probably work for this. Something you wear on your wrist all day every day is a very personal choice.
The following image is the sleep report I get from the Mi Fit companion app:
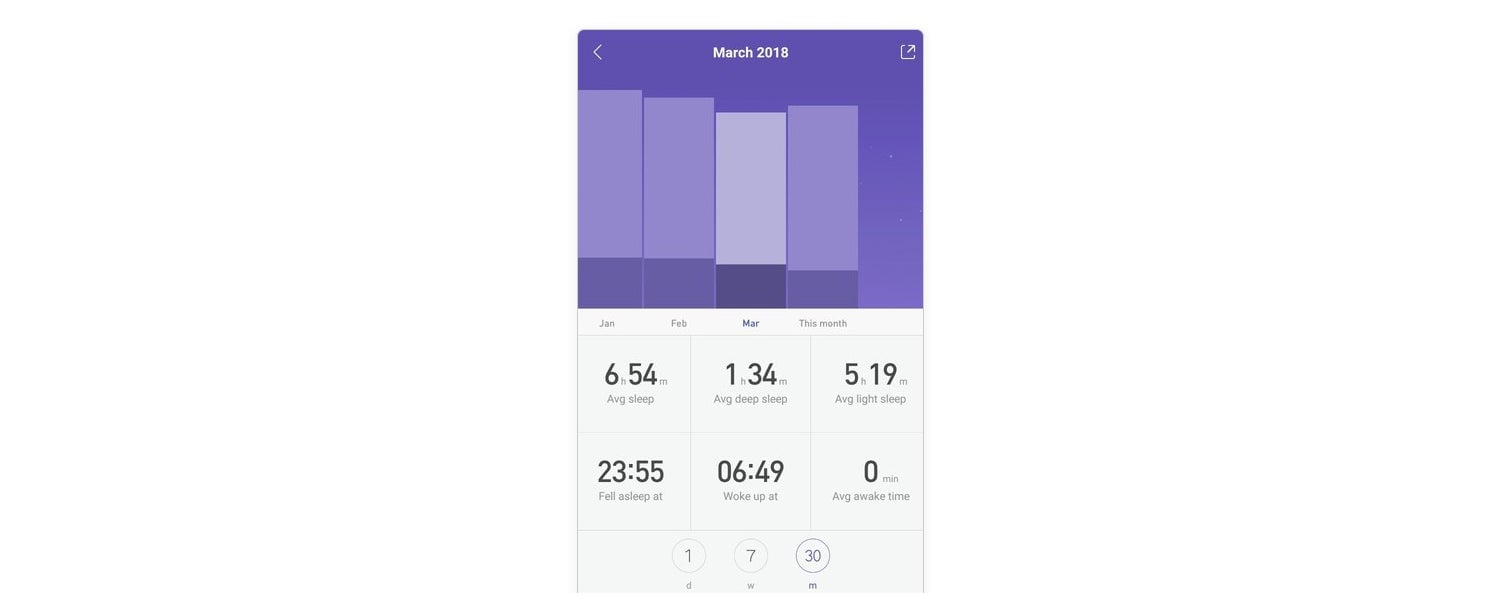
It’s possible to see sleep by day, week, and month. The above screenshot is particularly useful because I can compare not just my sleep time, but also my sleep quality with the previous months. The dark purple represents deep sleep based on my movements during the night.
With these reports, I analyze my data monthly and decide if it’s good enough or if I should change my routines to improve the time and/or quality of my sleep. A good example from the screen above is my average sleep time: less than 7 hours isn’t great, so I will probably come up with a plan to improve that in the next months.
The best app I’ve found to track food and exercise is MyFitnessPal. Their database on foods is unparalleled. I’m tracking my daily food intake and exercises again, but it isn’t something I do all the time. I have done this kind of tracking in the past when I was dieting and the experience was outstanding.
By using MyFitnessPal, you keep track of your calories, macro-nutrients, types of food, sets of exercises, water you drink, etc. It’s a manual process, but worth the price if you’re working on improving yourself in that regard.
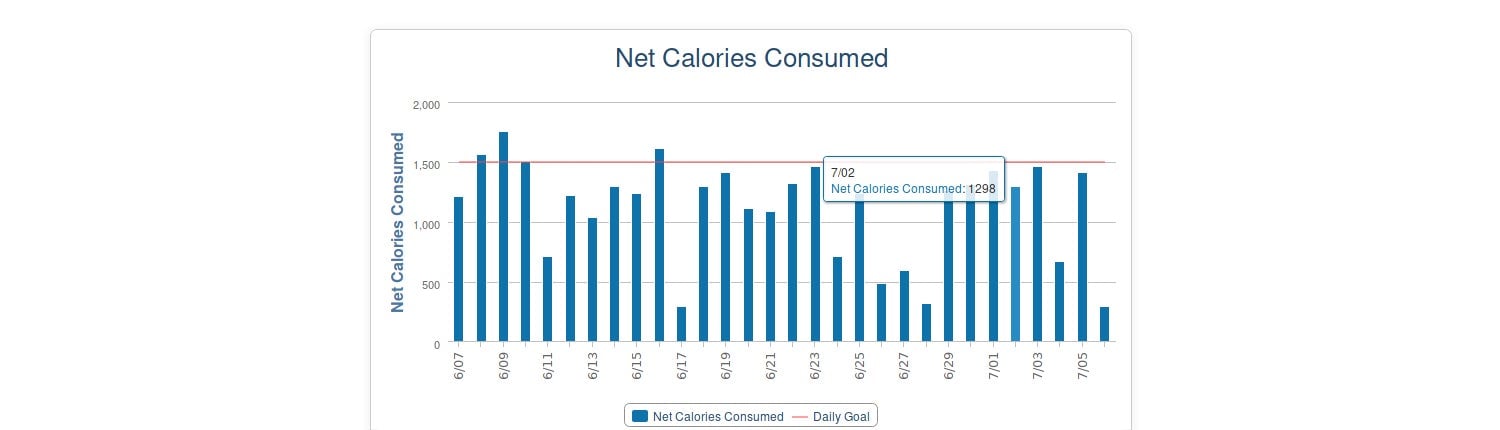


It’s quite hard to track your food intake because it’s a manual process and the result is most valuable if you’re following some kind of diet. But sometimes just tracking a week here and there provides a helpful datapoint on whether you’re generally eating the right kinds of things in the right quantities.
Money is one of the most important things I track. I’ve done it faithfully for many years. Keep in mind that tracking your money is not the same thing as controlling your expenses. You can track your money without changing anything in your lifestyle. The awesome part is that you’ll be able to look to your expenses and decide if they added value to your life or not. You’ll also be able to look at past spending data to decide if you can afford a large purchase — like a house or a long vacation.
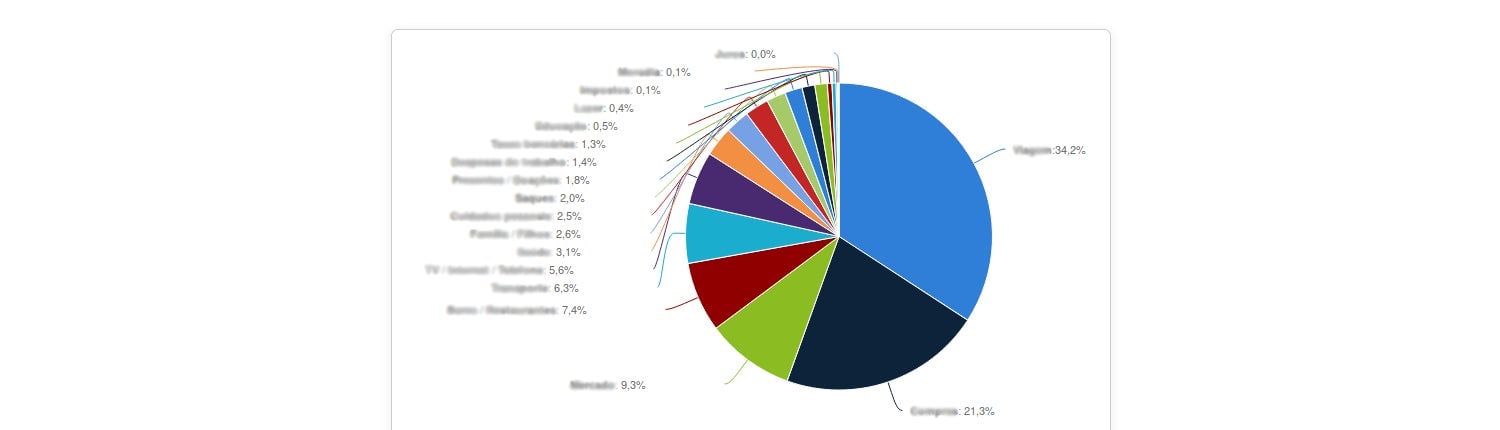
I use a local app that is free and connects to my bank to get my expenses. They use your data to connect credit companies to you. If you’re OK with that, it’s a neat app which saves you a lot of time in categorizing expenses, but it’s only useful in one country which doesn’t use English as their native language.
In this app I can generate an image like this, where each percentage is a category (e.g. Entertainment, Home, Travel, etc.):
Instead of recommending an app most of you won’t be able to use, I suggest YNAB (You Need A Budget). There’s a specific personal finance philosophy and system built into the app (which is really effective, btw), but they also have all the same features as the app I use:
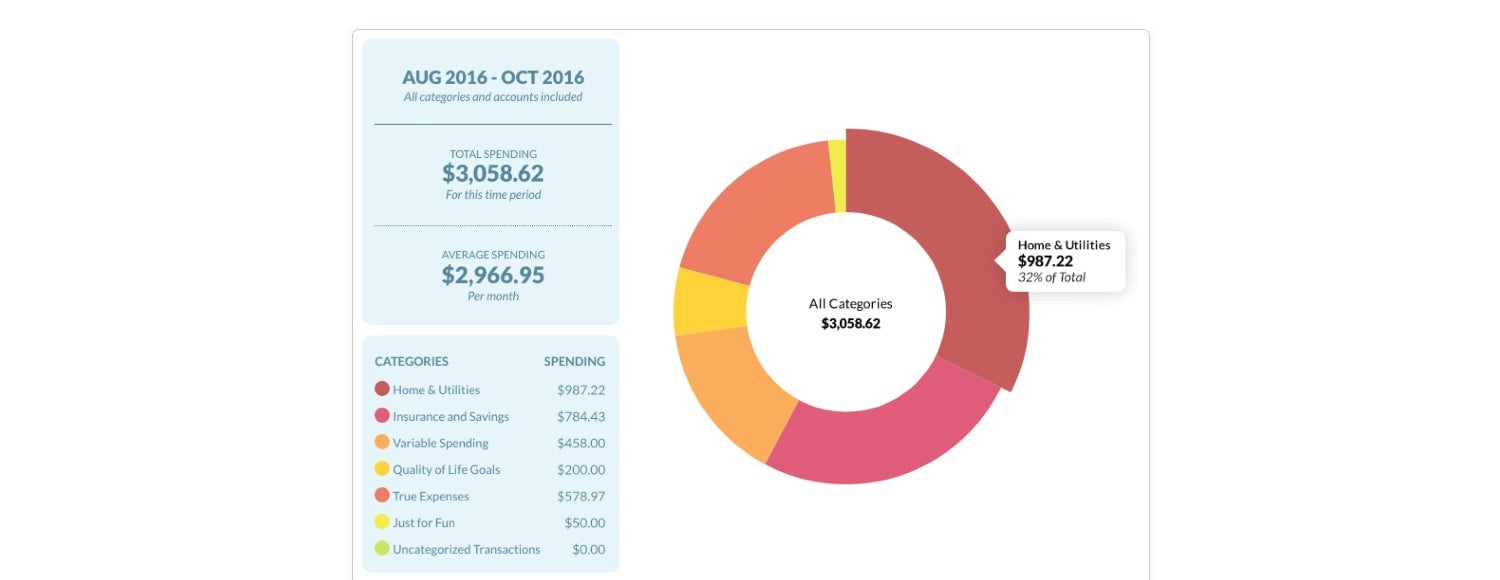
The problem with YNAB is that it’s a paid app, so you have to decide if you want to invest in it or not. Mint and Clarity Money are popular “free” (or at least unpaid) alternatives, but I don’t have personal experience with either.
Do you know how many words you write in one month? What about how many mistakes you make when writing in English? Grammarly can help answer both of those questions.
I recommend using it especially if you’re a non-native English speaker. It identifies common mistakes that can easily go unnoticed (e.g. prepositions).
Grammarly sends you a monthly newsletter with your stats for the previous month. It looks like this:

Unfortunately, the newsletter is Grammarly’s only source of metrics, but I did some manual extracting to create this spreadsheet:

It’s nice to see the number of words written increasing, but not the number of corrections made. It seems I’m improving!
And of course, you can always challenge yourself to a specific word count goal per month.
This section is a bonus for those who write code on a daily basis. If you want to keep track of how many hours you spend writing code and which languages/editors you’re using, I highly recommend using Wakatime.
I use their embed charts in my now page (based on Derek Sivers now page). One of the charts I like the most is my language breakdown:
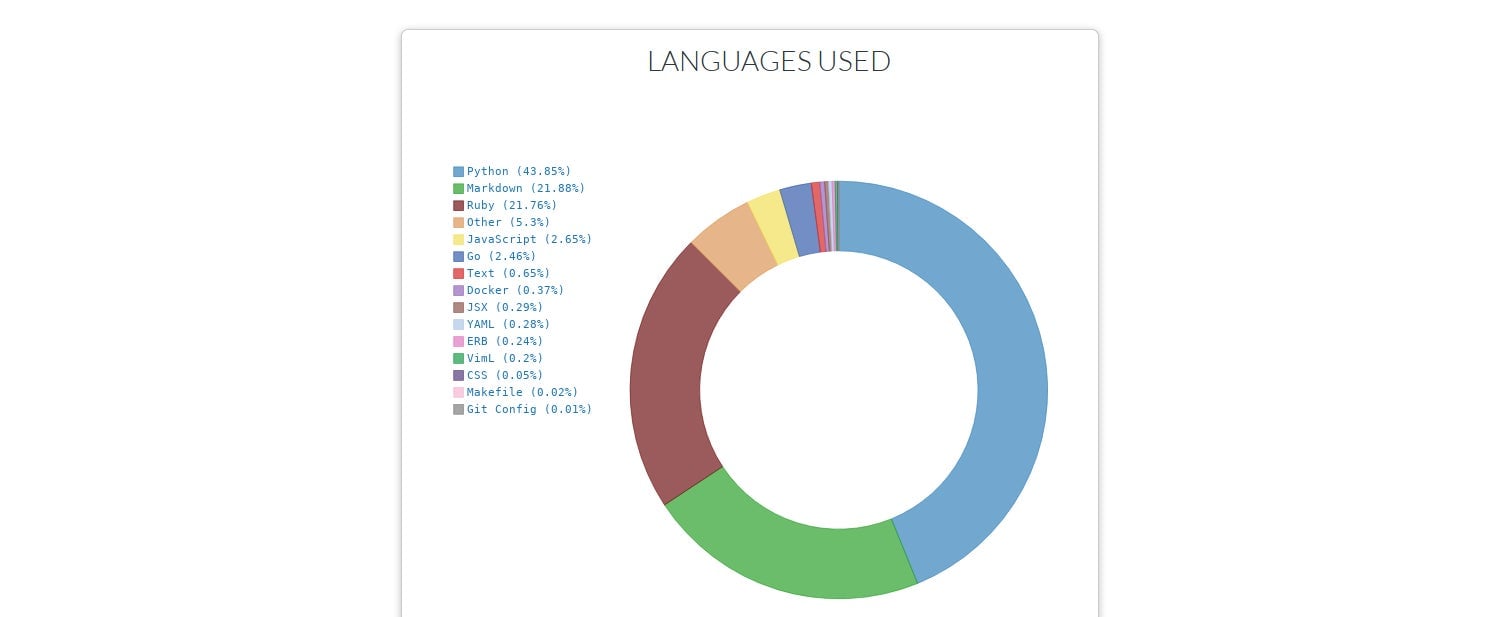
To make it work, you have to install their plugin on your IDE/Text editor, but the process is quite easy.
Sometimes you want to track something specific that no apps provide. In those cases, you can fall back to Google Spreadsheets and build your own metrics. As an example, I set up a goal to do public talks 20 times in one year and was keeping track of it on a monthly basis.
The following image is the final chart I had last year:
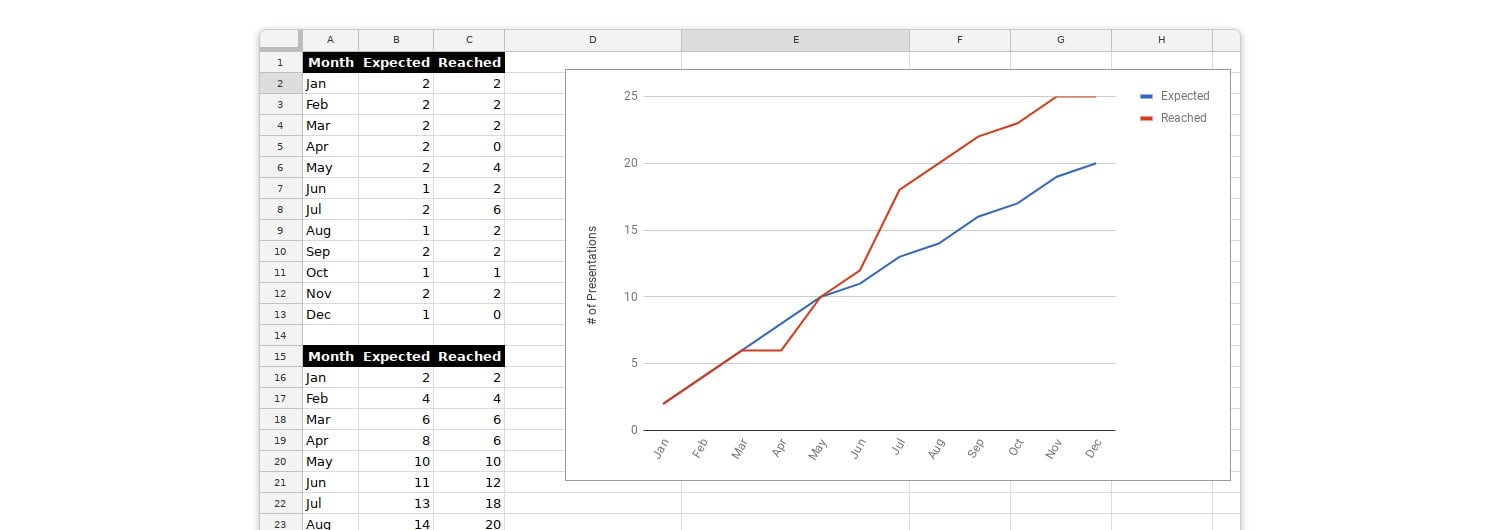
It was quite nice to understand where I was that month in relation to what I had planned. You can see that things changed when I saw that I was behind my schedule in April.
You could create a “goal vs actual” line graph like this for any metric — books read, articles published, miles run, revenue earned, etc. Here’s a great guide from Lucid $LCID Chart that will walk your through how to set it up.
If you keep your Google Sheet tracking to one or two main goals you want to focus on, the extra motivation of visualizing your progress (or lack thereof) can be worth the manual effort. (It may be helpful to add a weekly or monthly recurring task to Todoist to remind you to keep it up.)
If you don’t want to provide data to third parties, spreadsheet software is actually an excellent tool for tracking any of the things I’ve covered so far in this guide. You can use Google Spreadsheets, Excel or OpenOffice Calc to build your own simple system with charts, etc. Keep in mind that it will take some time and effort to create and maintain this kind of DIY tracking system, but it’s an option for those who don’t feel comfortable installing apps to track their activities.
I tend to follow the cheapest, most customized tracking setups, but sometimes it’s good to have things nicely laid out for us even if we have to pay for it. Let’s evaluate a free and a paid way to start aggregating your data.
Free
You don’t need to use all those apps and strategies at the same time to get the benefits of tracking. If you want to start collecting metrics about yourself, you can pick one of those apps/strategies and apply to one particular area of your life.
For example, you could start with RescueTime. It doesn’t require daily manual input (just some configuration to the categories of the apps at the start), and you’ll start see interesting patterns after just a few weeks.
Paid
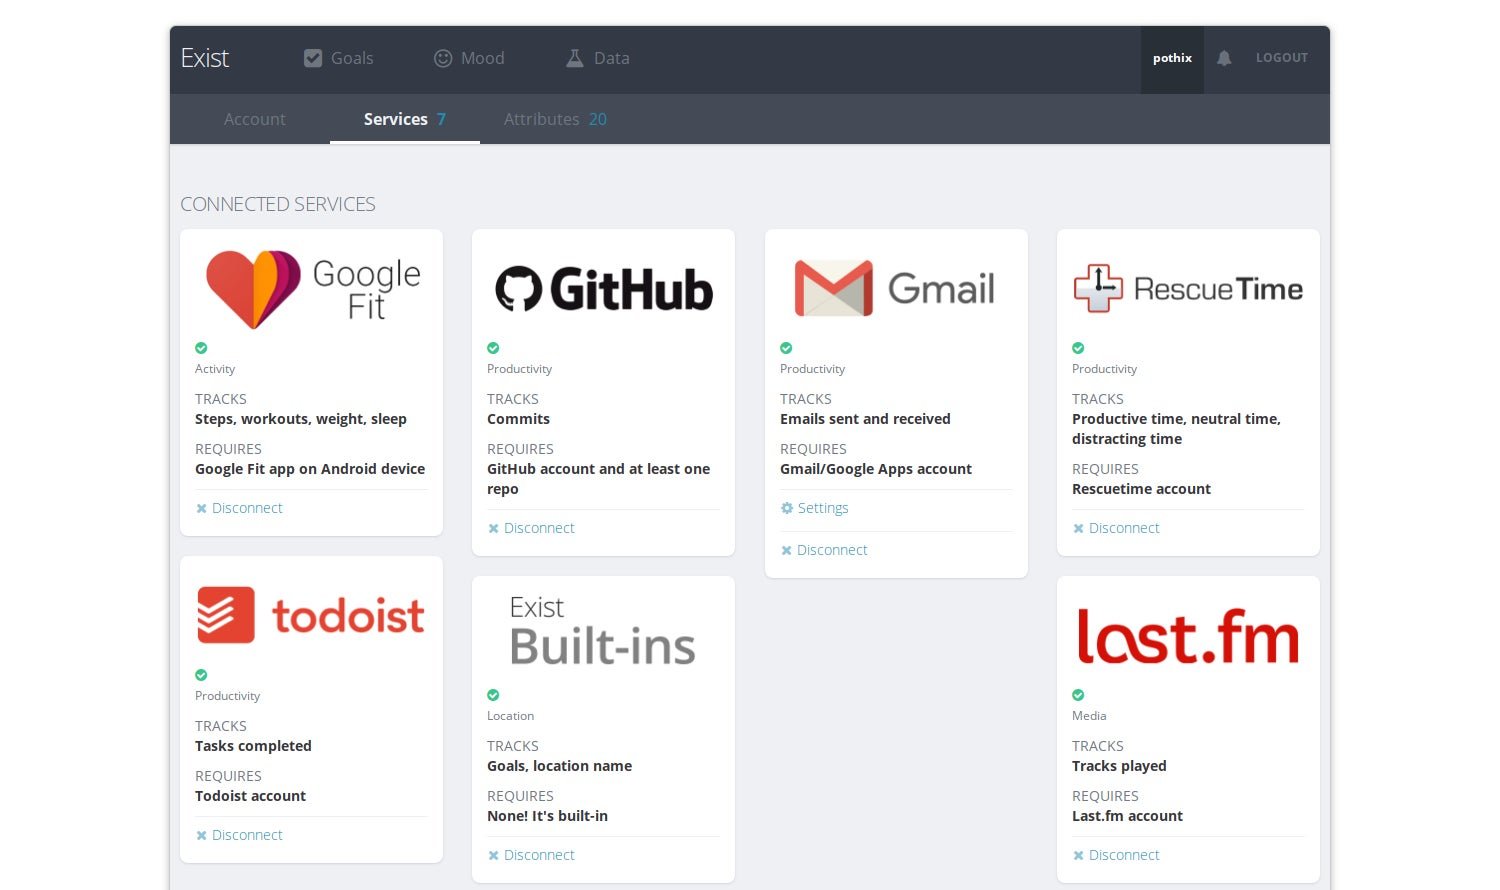
If you’re OK with using apps to track your data and are up to pay for a service that helps, I would recommend giving Exist.io a shot. It’s a paid service but you can try it for 30 days for free and 60 days when you’re referred. The link I provided is my referral if you want to try it out for two months.
You can think about it like a personal dashboard that brings all you data into one, easy-to-see-and-analyze place. The app will guide you through the apps they connect with and you can connect with the ones you use:
You’ll soon have charts like these:
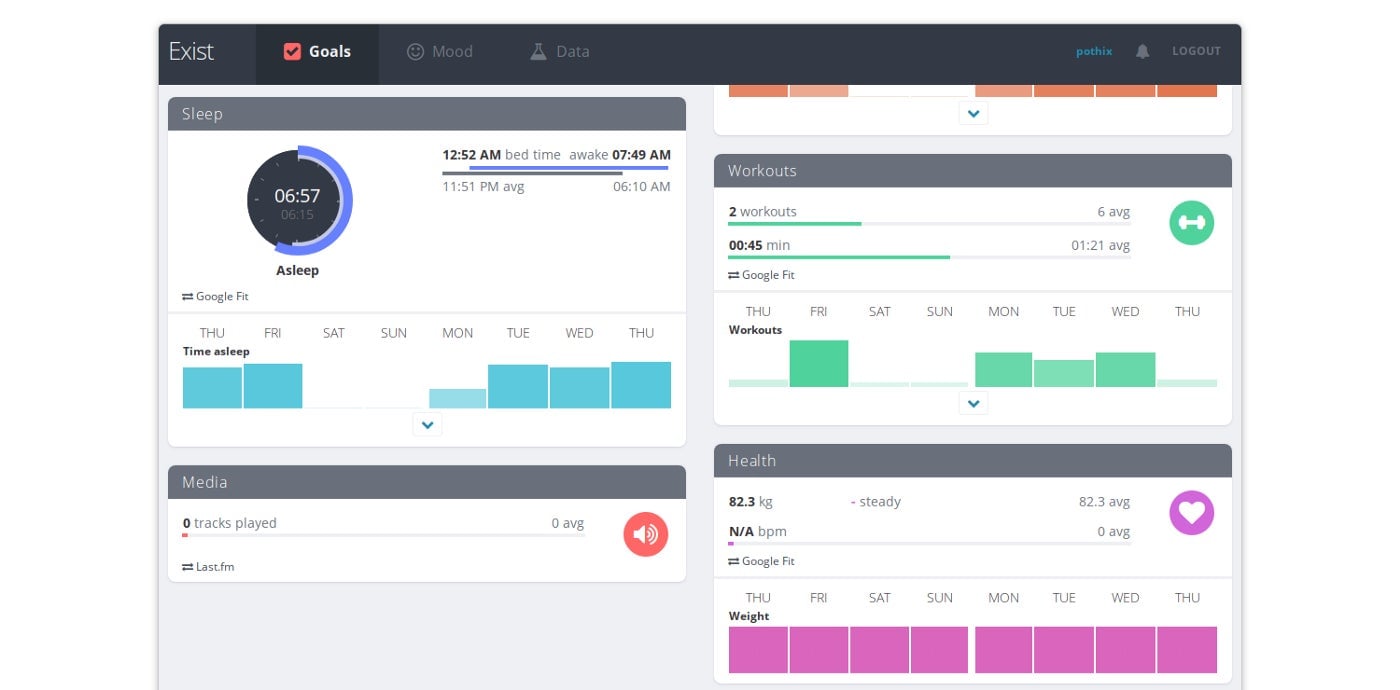
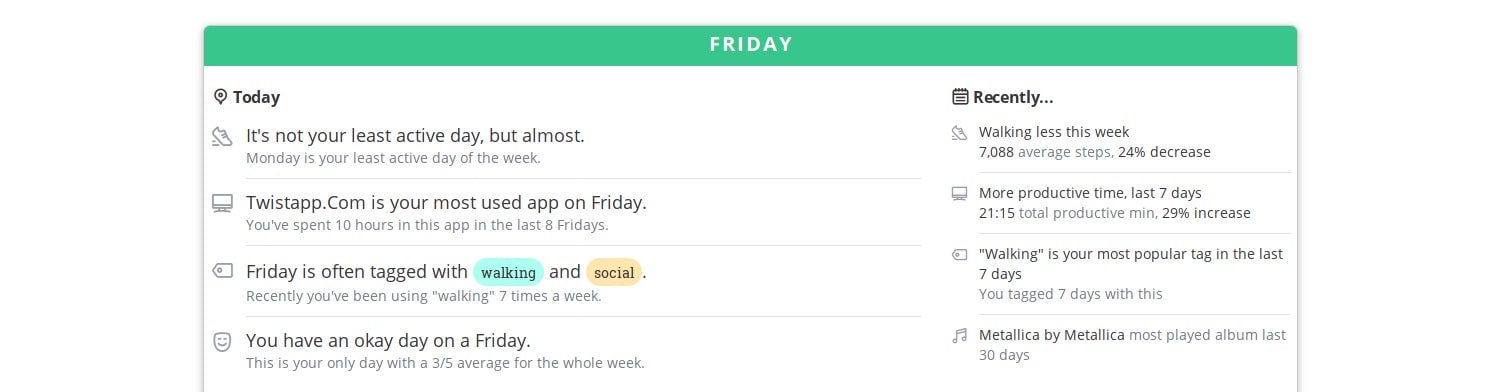
In addition to centralizing your data, the app lets you add custom tags to your days and spits out interesting insights automatically — like correlations between productivity and exercise or even weight and locations you’ve visited. It also sets personalized goals based on your current averages and even has built-in mood tracking which isn’t an area I’ve covered in this guide.
It’s an excellent service and a nice company.
In short, continuous improvement. Good habits are hard to form. Bad habits are hard to break. It’s difficult to do either of those things without bringing conscious awareness into your life.
Tracking your data lets you take an honest look at how you actually spend your time (rather than how you think you spend your time). It’s not about blame or guilt over past behavior. It’s about noticing patterns and making intentional decisions to be a little bit better next month. It gives you the chance to become a better person — whatever that looks like for you.
It also just feels good to know that you’re aligning your life with your values and priorities in a tangible, measurable way.
Here is a summary of what I can (and have) improved after checking my metrics regularly:
These changes have added a ton of value to my life. You likely won’t reach the same conclusions. As everyone likes to say, there’s no one-size-fits-all solution. You can read all the life and work advice out there, but in the end everyone is unique. Gathering your own data lets you optimize your life for what you want to get out of it. You may never quite reach your own ideal (how boring would that be anyway), but you will continuously improve along the way.
This article originally appeared on the Doist blog.