Search
Newsletters
Editions
Home
Latest
Business News
Money & Markets
Tech & Innovation
A.I.
Lifestyle
Leadership
✉️ Emails
🎧 Podcasts
The 21 economic charts from April you really should see
Markets
The 21 economic charts from April you really should see
By
Matt Phillips
and
Matt Phillips
Share to X
Share to Facebook
Share to Reddit
Share to Email
Share to Link
Add Quartz on Google
Share to X
Share to Facebook
Share to Reddit
Share to Email
Share to Link
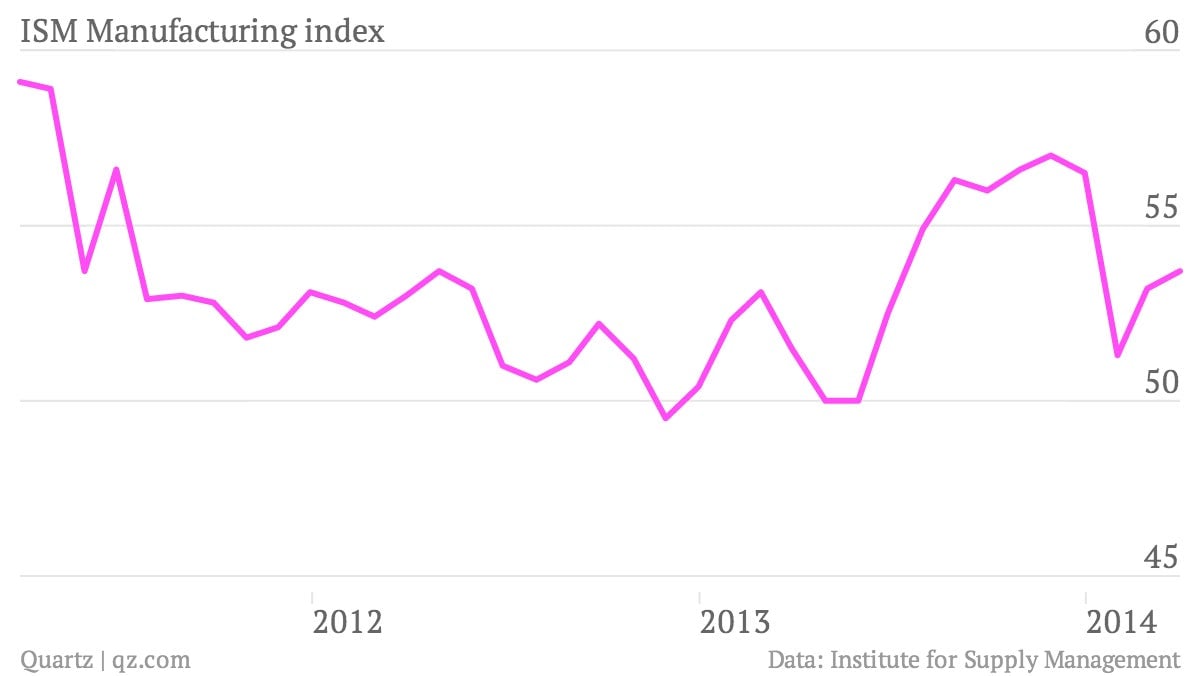
The US manufacturing sector
expanded in March
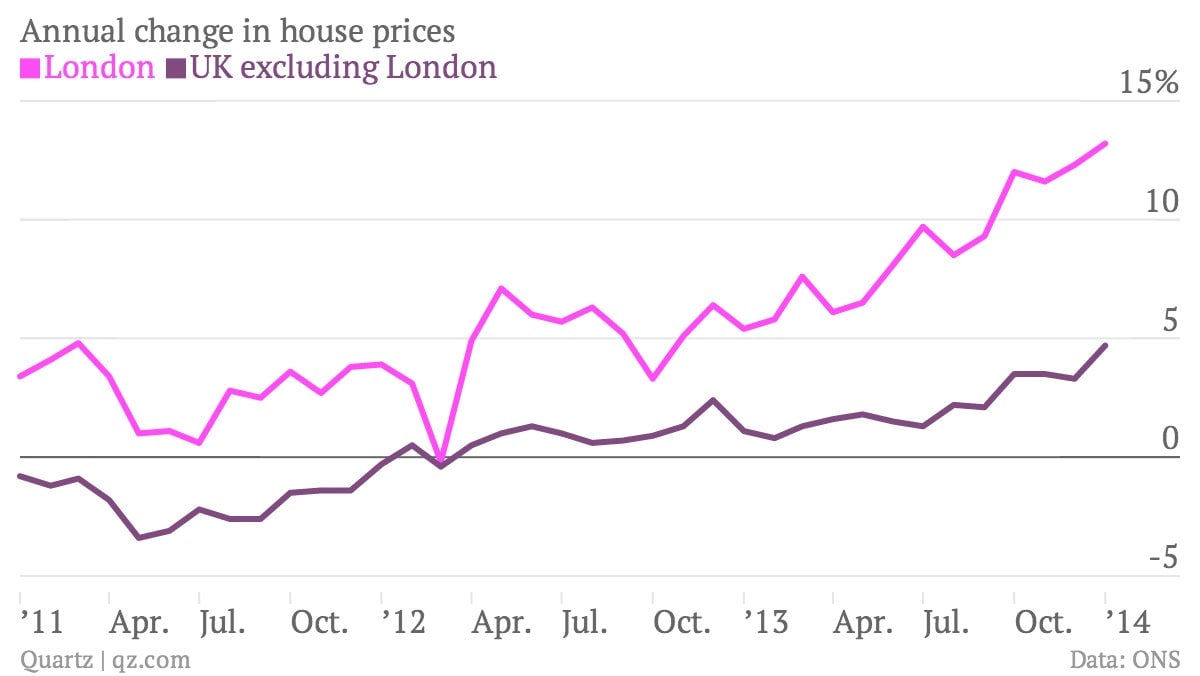
London house prices
continued going nuts
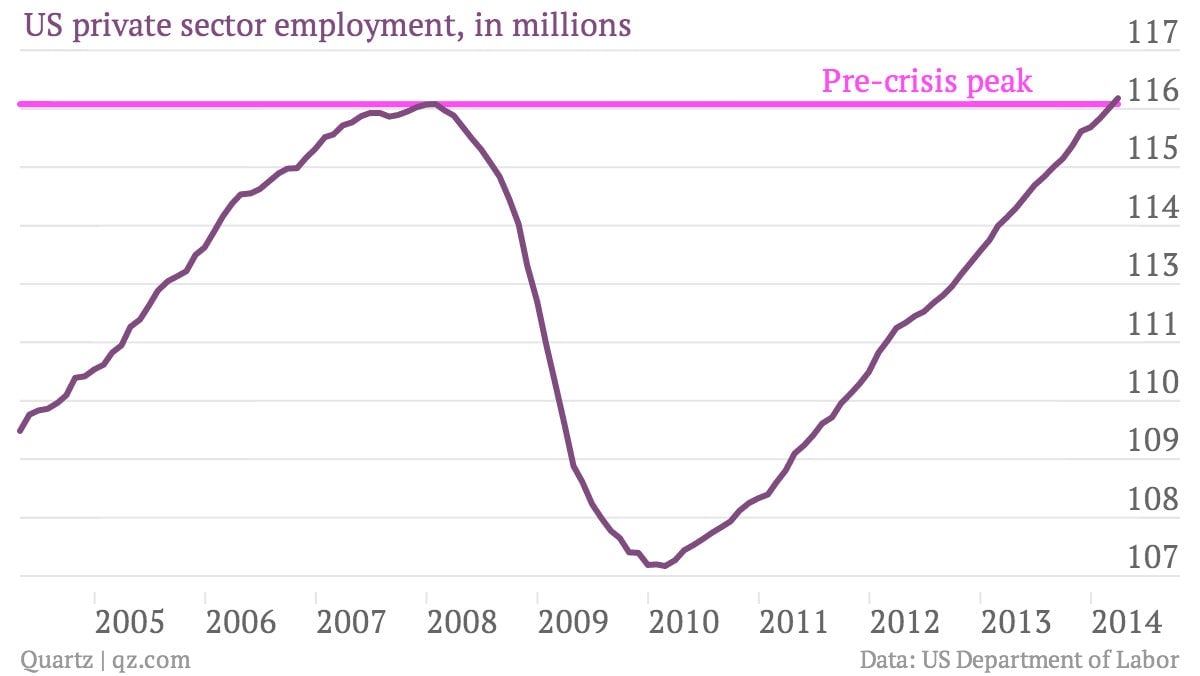
US private sector jobs finally began expanding in March
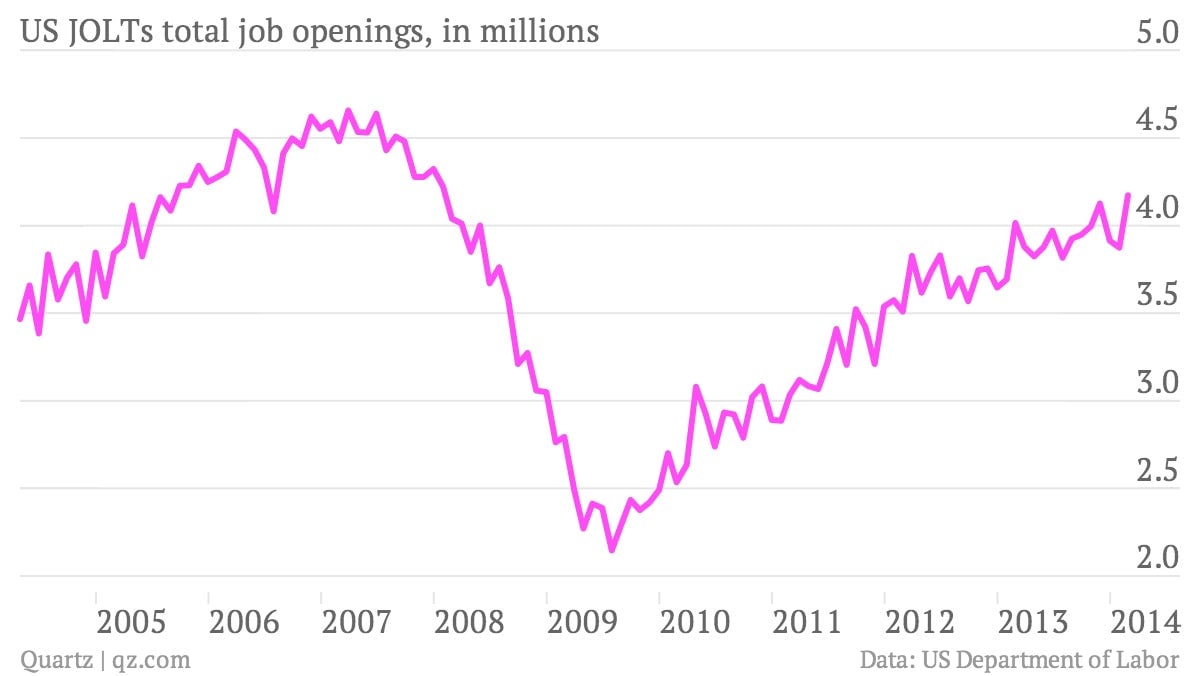
US job openings hit a post crisis high in February
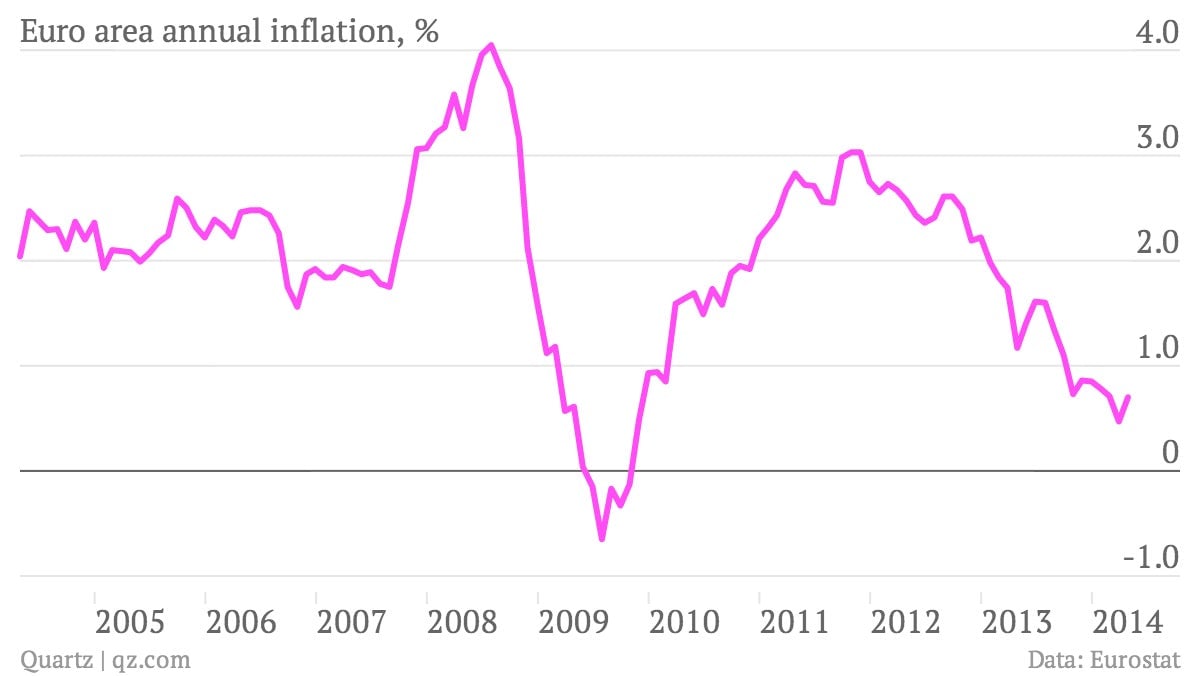
Euro area prices rose in April, but
deflation remains a risk
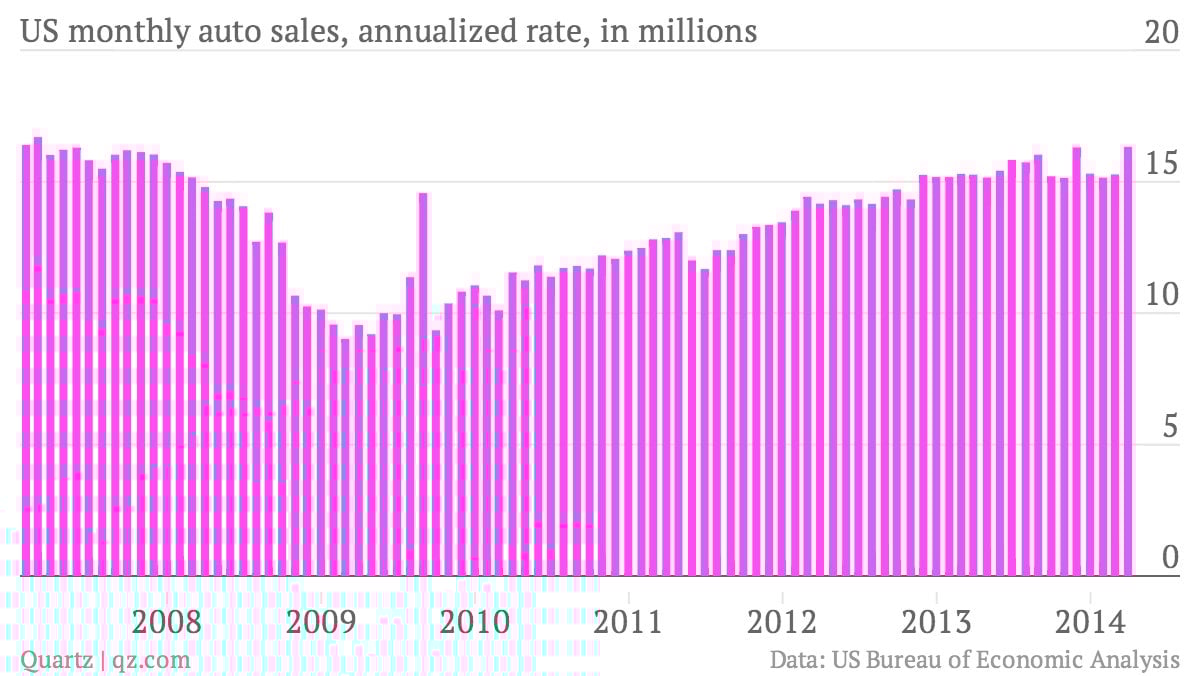
US auto sales
grew strongly in March
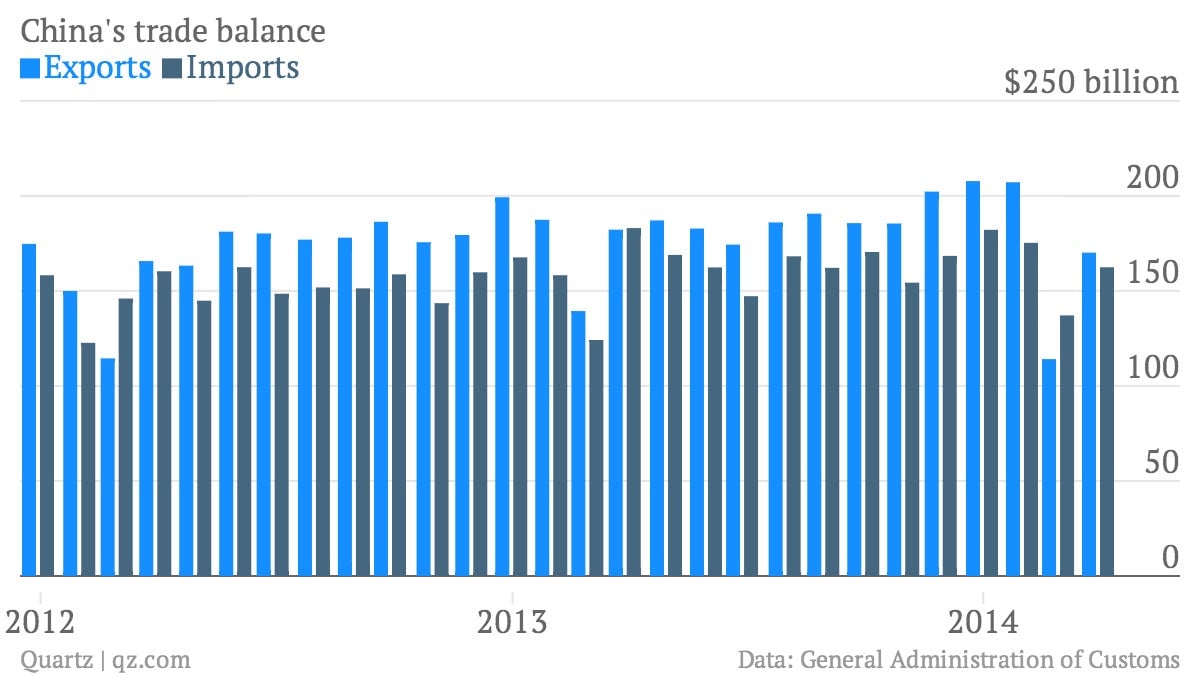
Chinese trade
continued to be soft
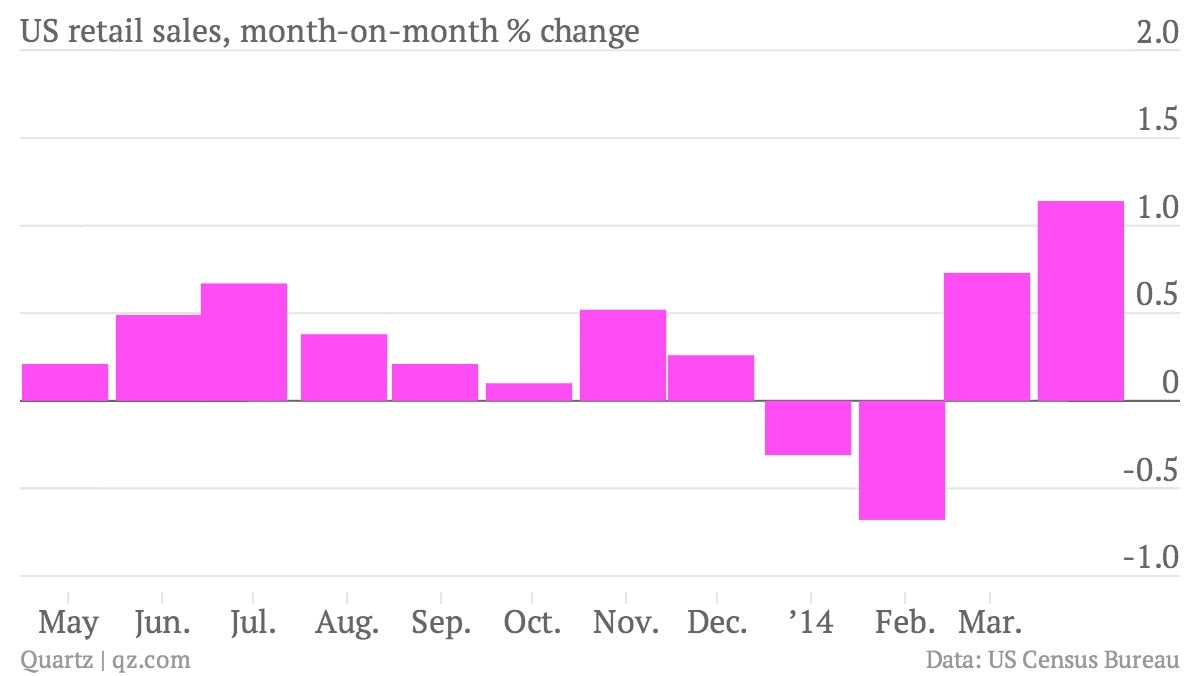
US
retail sales rebounded
after the frigid start of the year
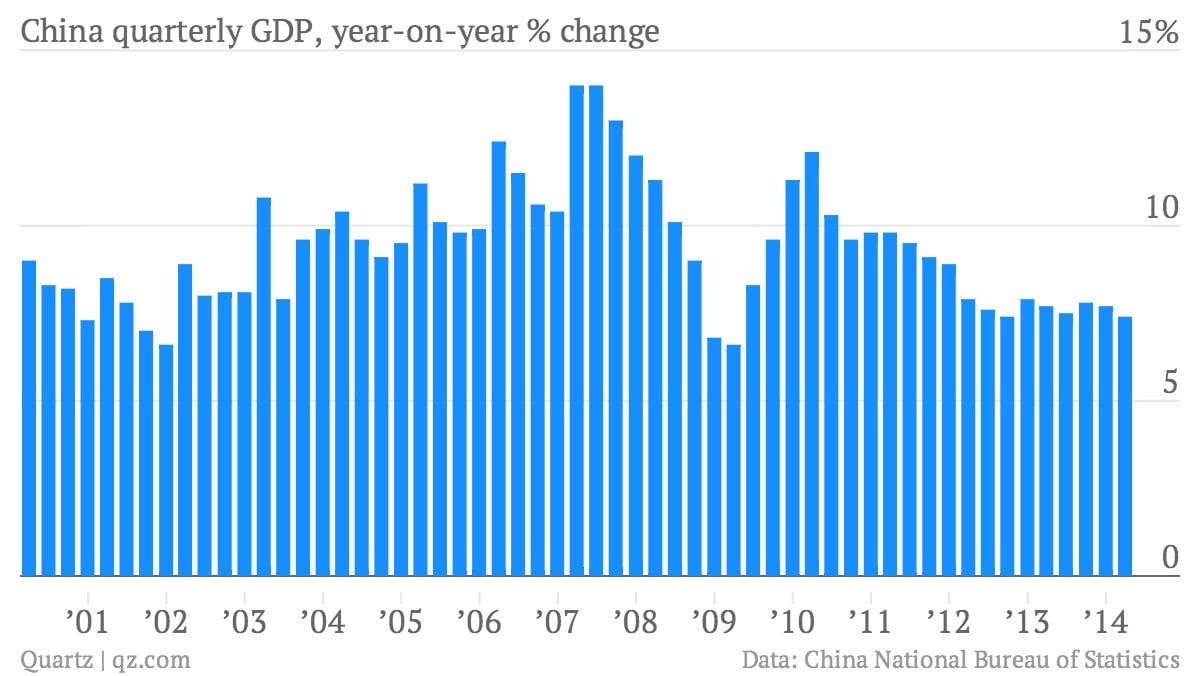
China’s economy
showed more signs of slowing
British unemployment
fell to a five-year low
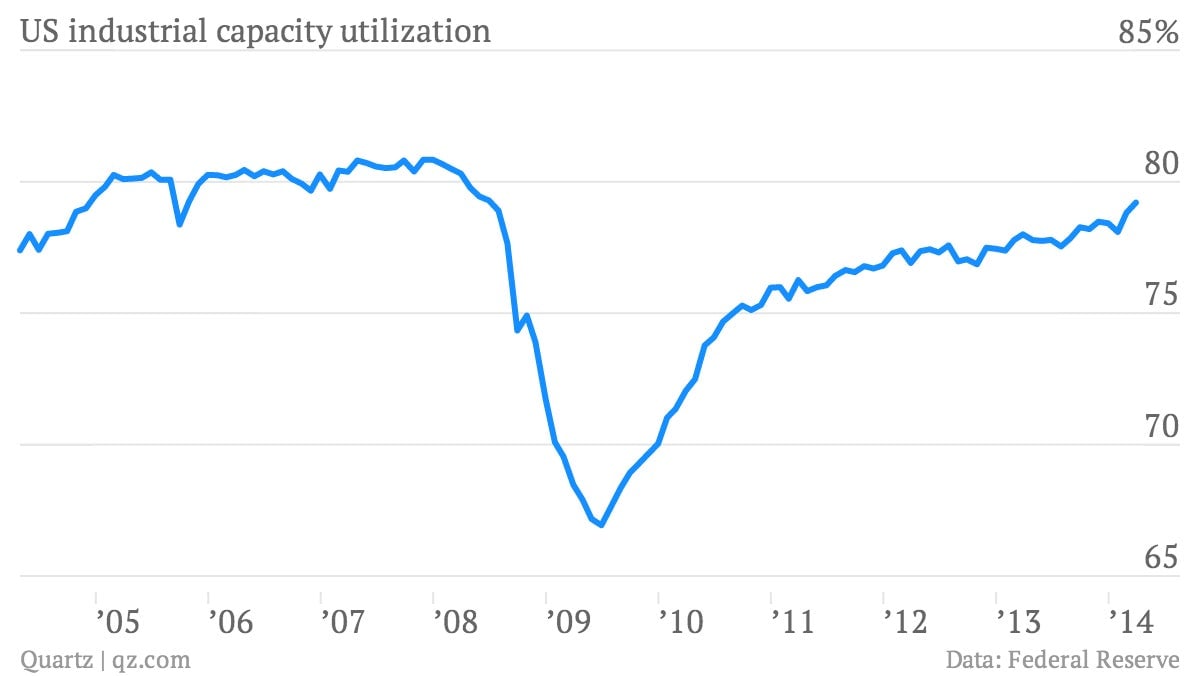
US capacity utilization hit a post-crisis high
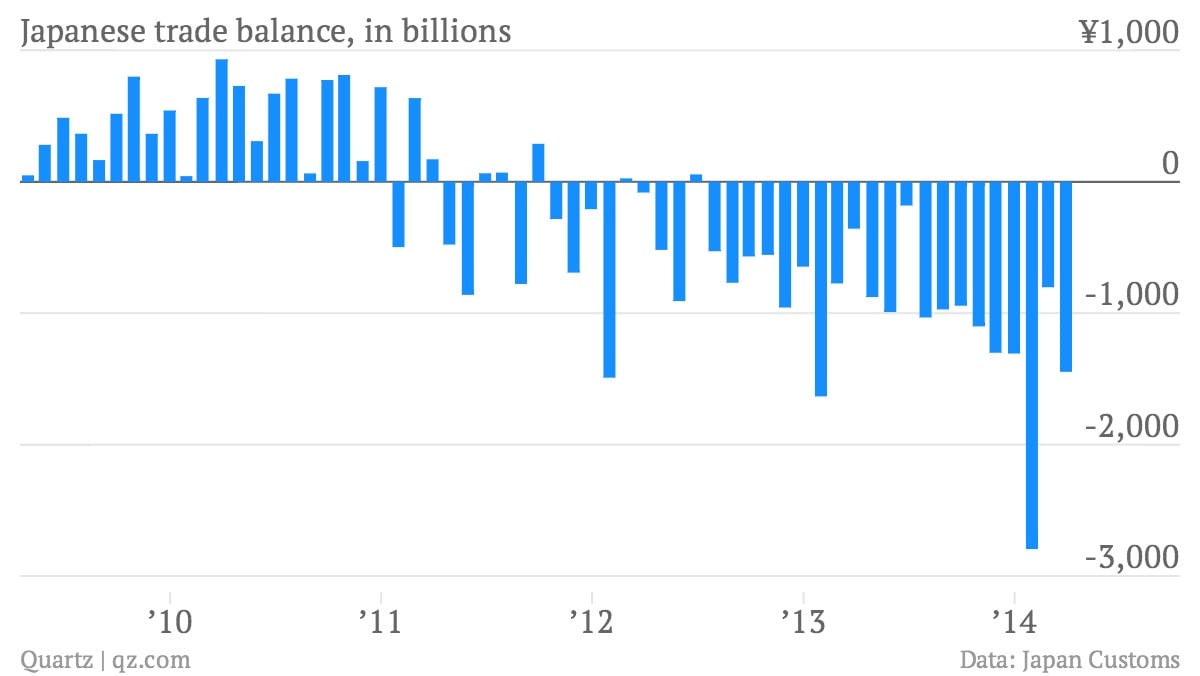
Japan’s trade deficit remained bad
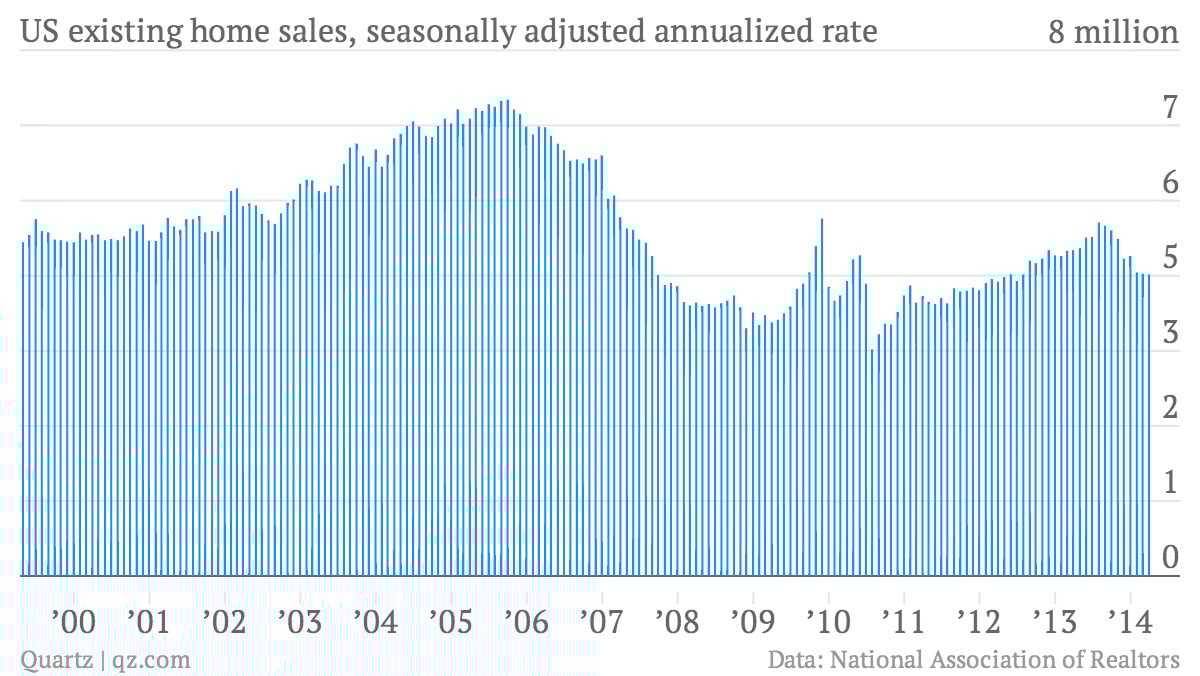
US existing home sales stayed soft…
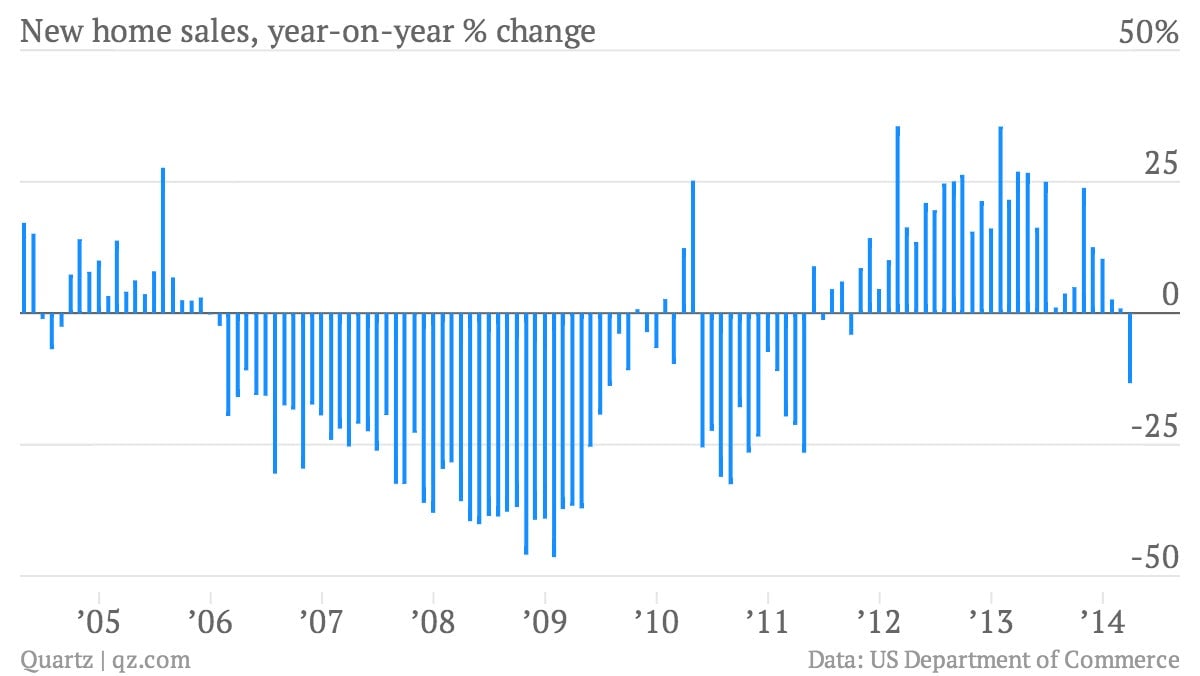
New home sales
dropped sharply
China’s
manufacturing sector contracted
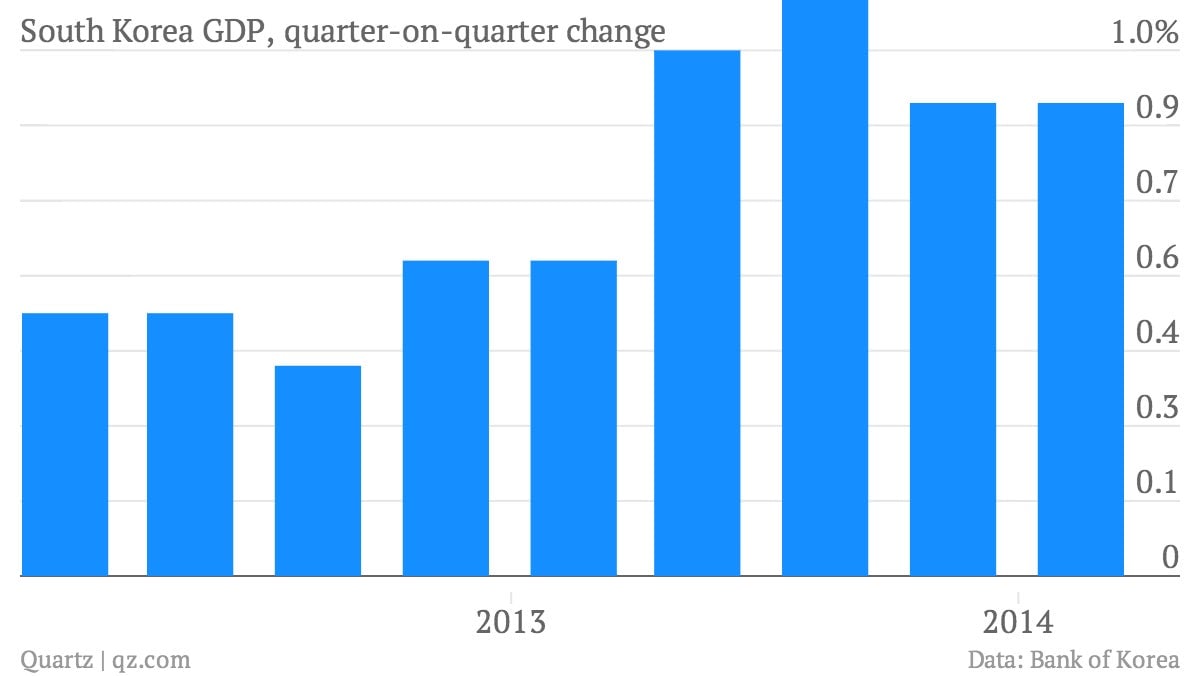
South Korea posted solid
first-quarter GDP growth
US
durable goods orders rebounded
April inflation in
Tokyo surged
, thanks to the new VAT tax
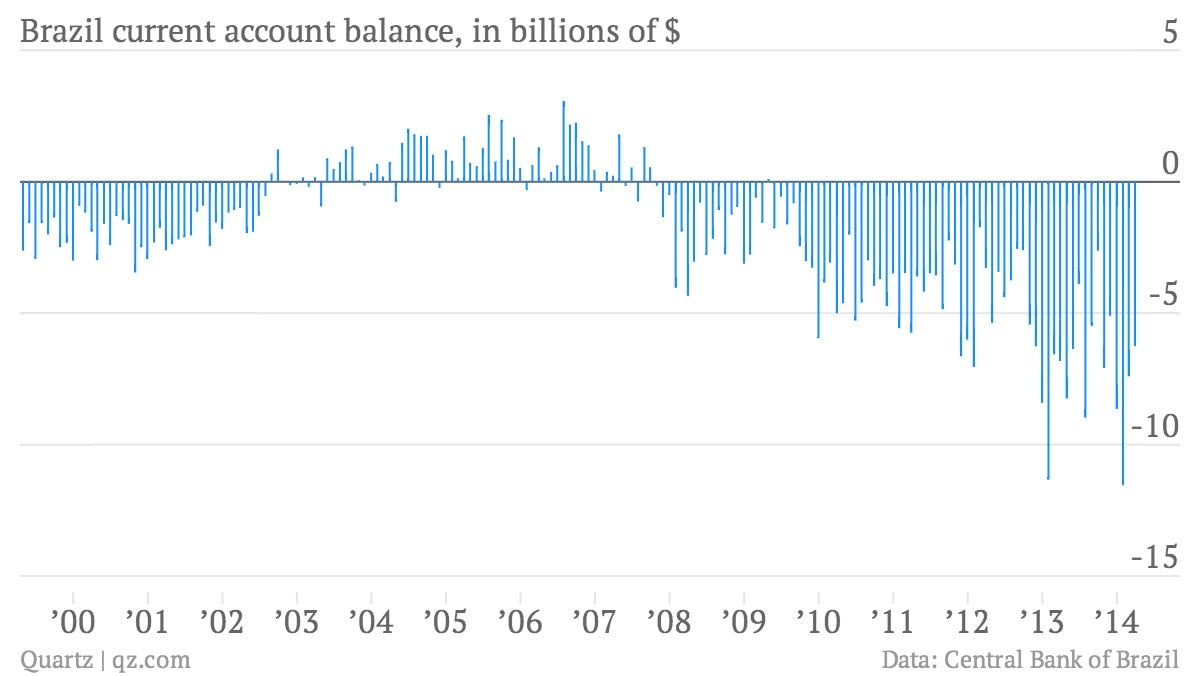
Brazil’s current account balance
narrowed a bit
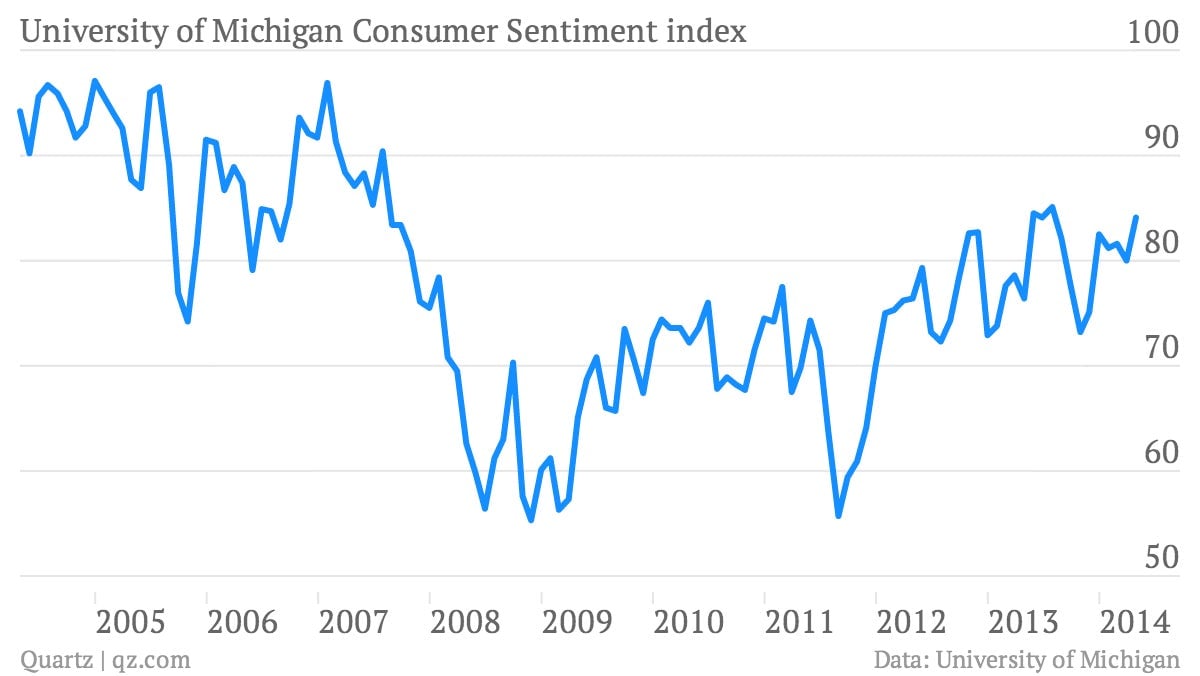
The mood of
American consumers improved
📬 Sign up for the Daily Brief
Our free, fast and fun briefing on the global economy, delivered every weekday morning.
Sign me up
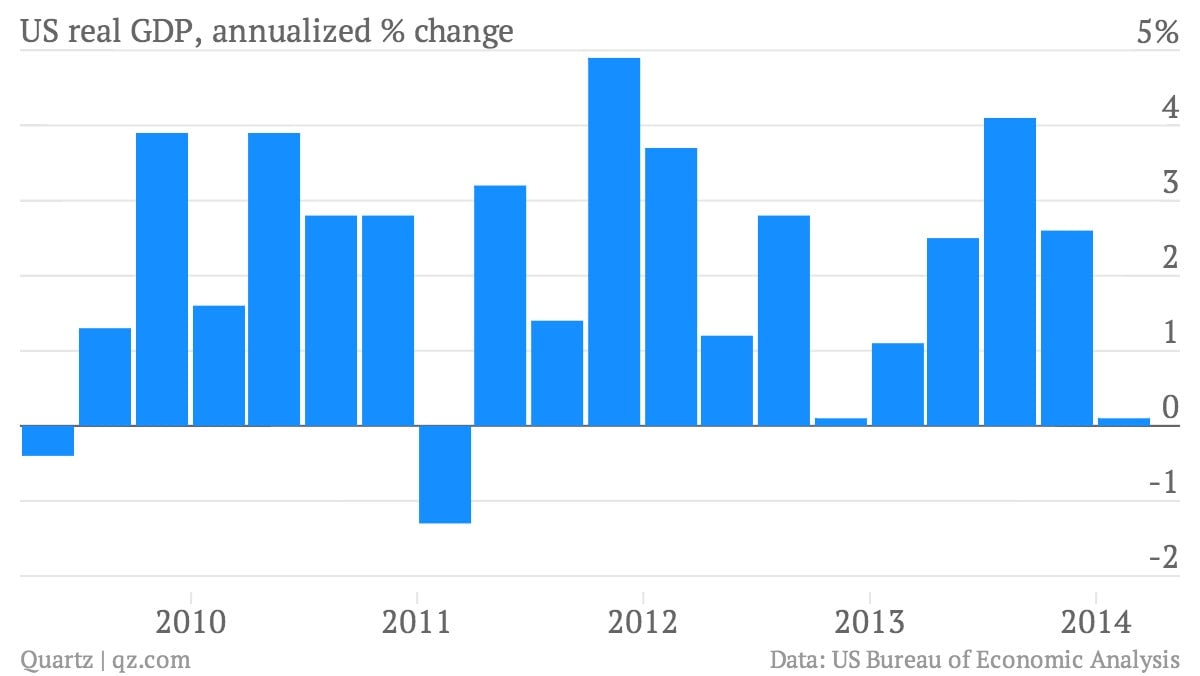
US GDP fell way
short of expectations