This week’s most important econ data—in charts
This week’s economic updates didn’t exactly offer a global picture on the state of the economy. The most important releases centered on the UK and the US. (Although a report on Chinese GDP early in the week was notable.) But a clear takeaway from the data—as well as the earnings updates from major corporations—was that the resilient US economy is a corporate sweet spot for growth. Here’s a day-by-day snapshot of the week:

This week’s economic updates didn’t exactly offer a global picture on the state of the economy. The most important releases centered on the UK and the US. (Although a report on Chinese GDP early in the week was notable.) But a clear takeaway from the data—as well as the earnings updates from major corporations—was that the resilient US economy is a corporate sweet spot for growth. Here’s a day-by-day snapshot of the week:
Monday
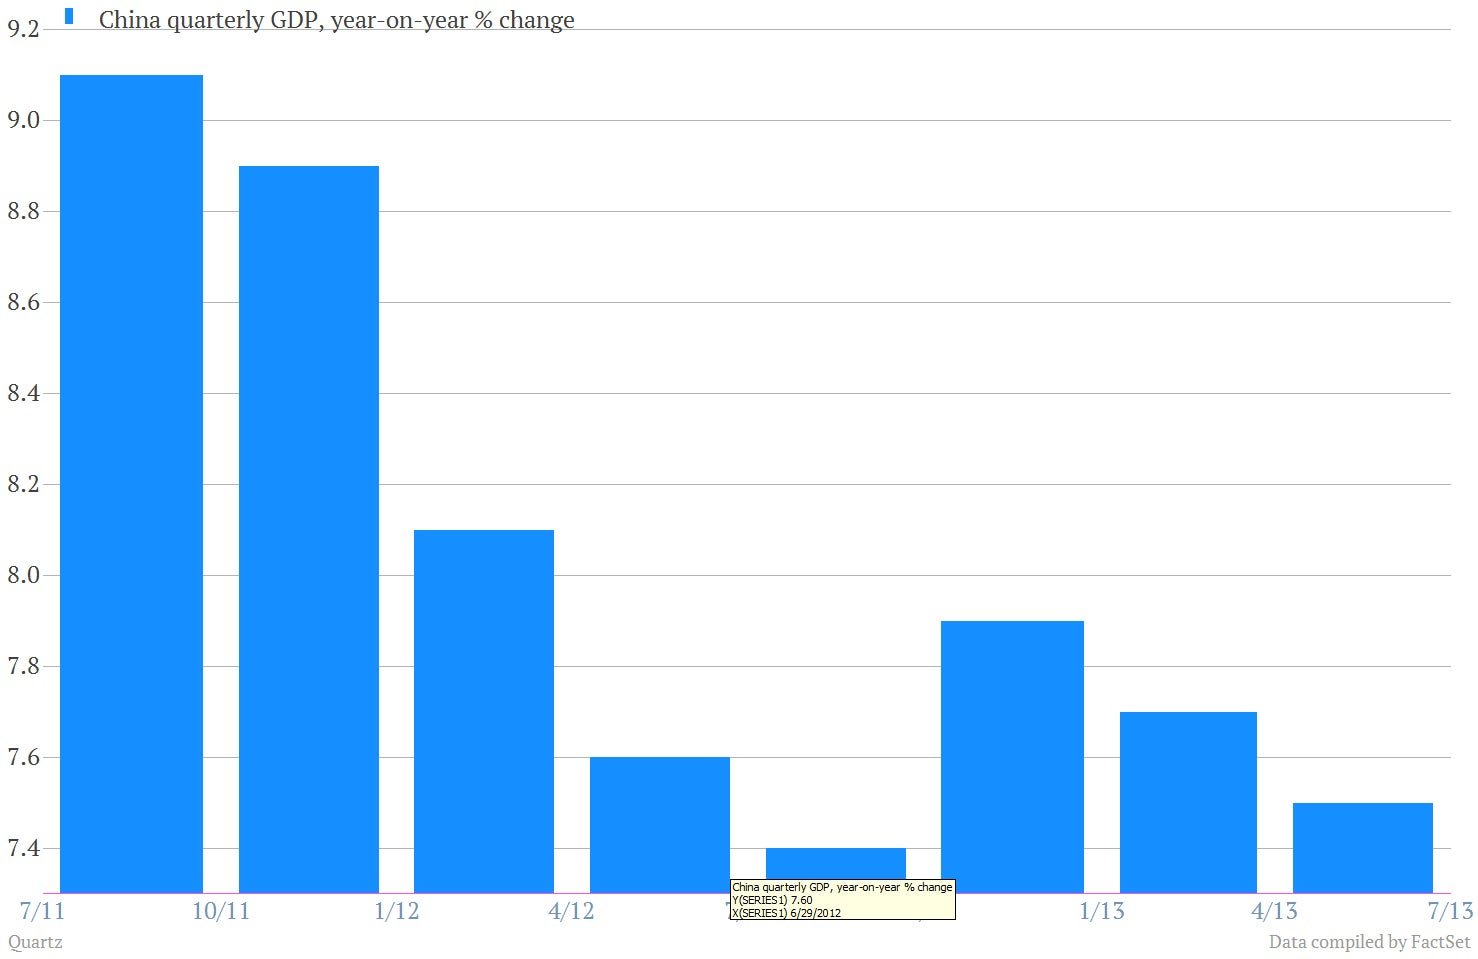
1. Chinese GDP slowed to 7.5% in the second quarter, extending the longest string of sub-8% growth in at least two decades.
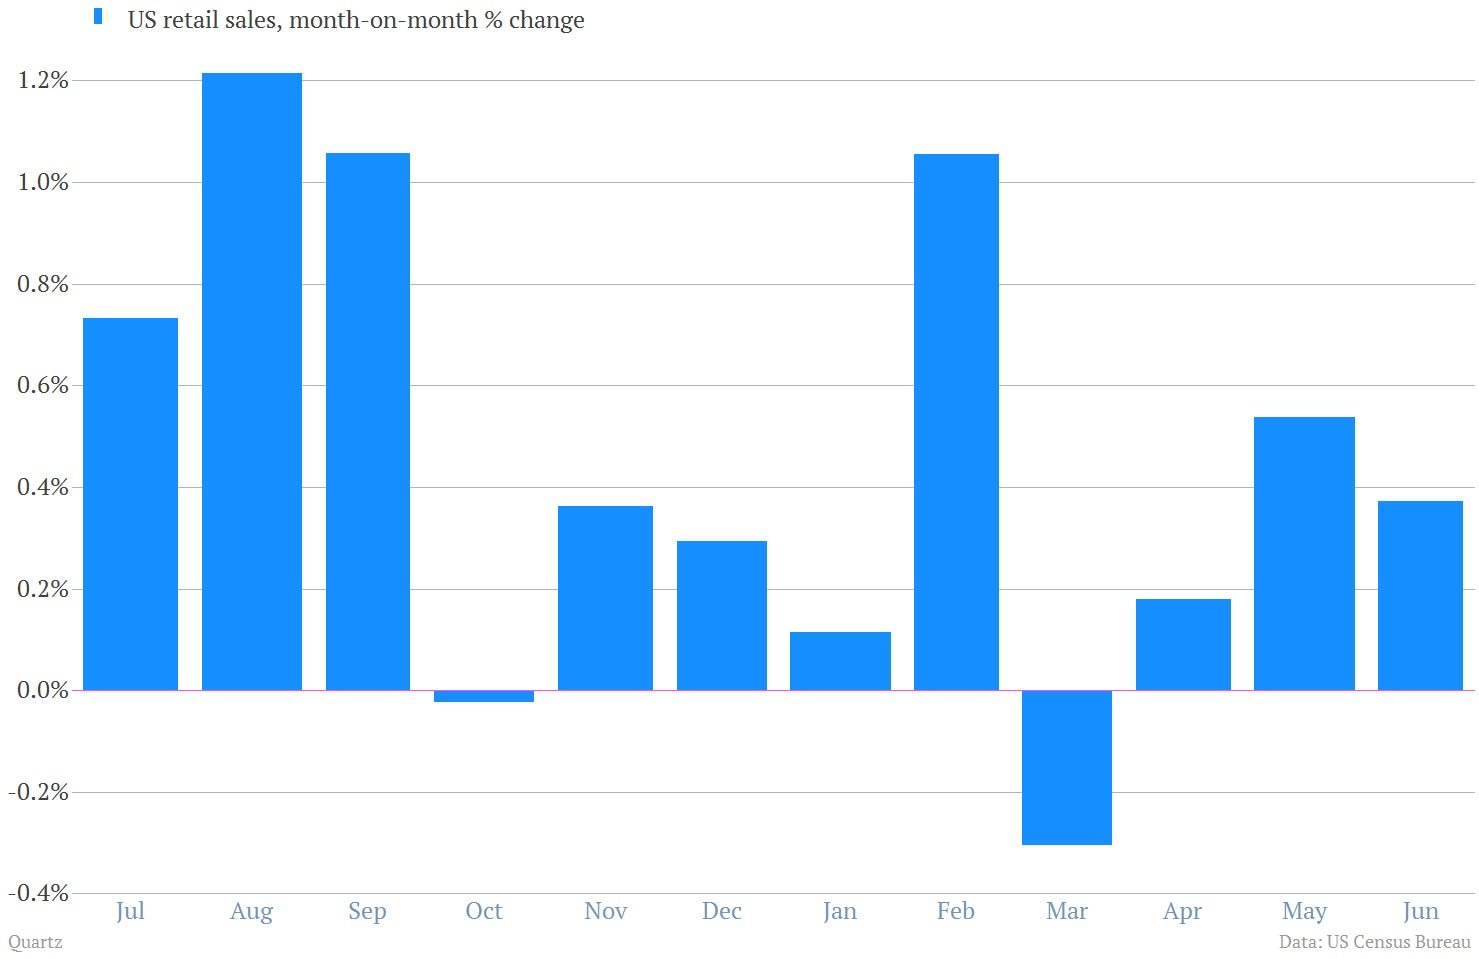
2. Autos helped produce decent retail sales in June. (But slightly less than economists expected.)
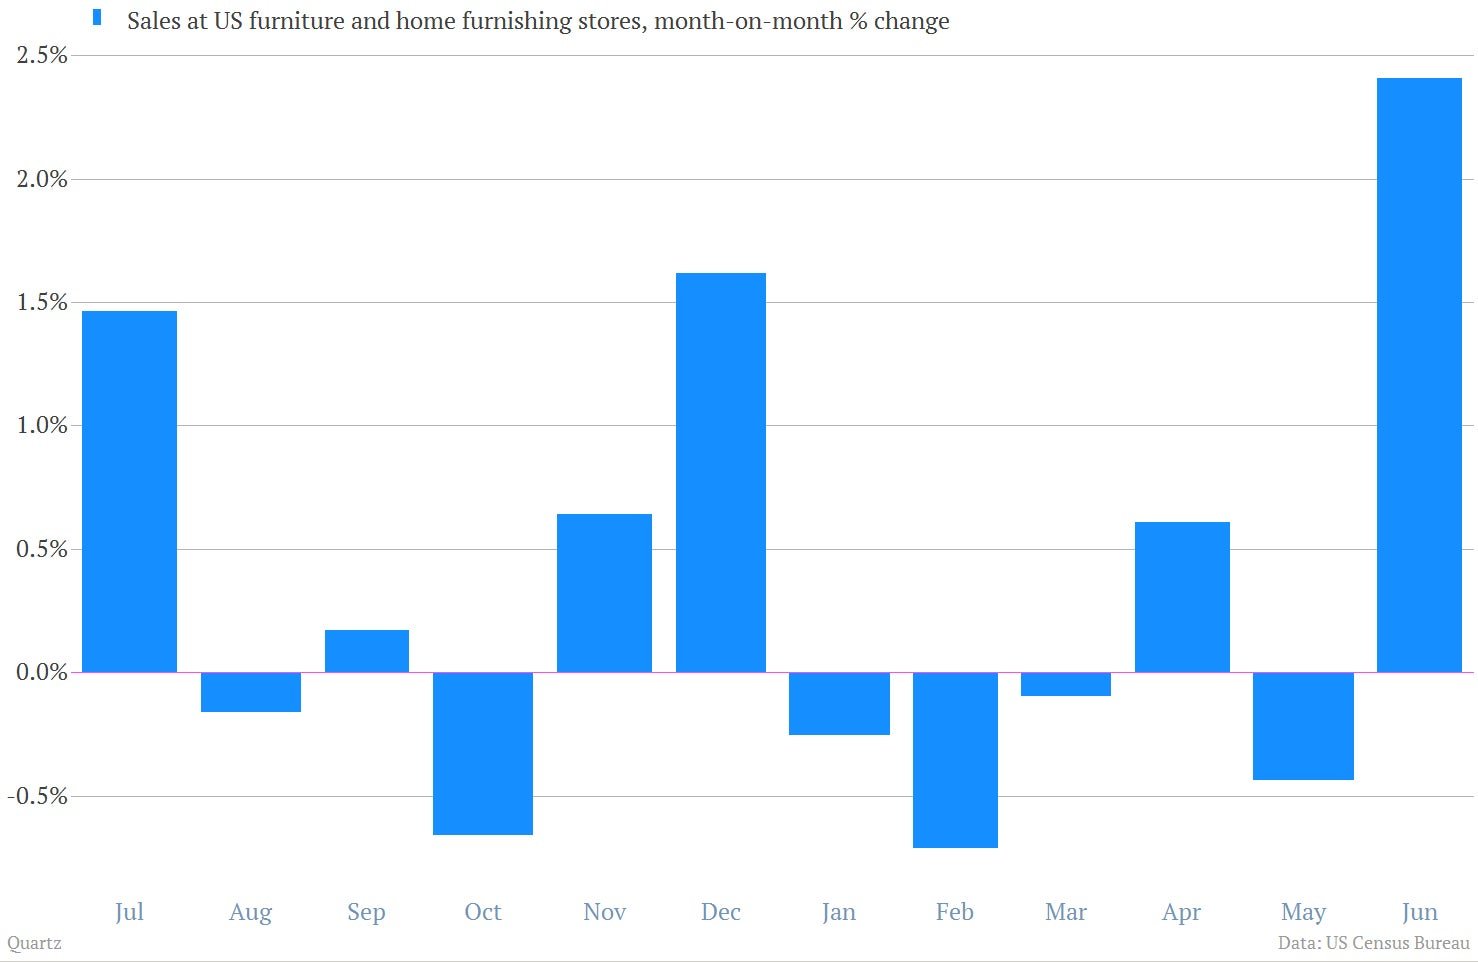
Furniture sales spiked, indicating that the benefits of the housing recovery are touching more parts of the US economy.
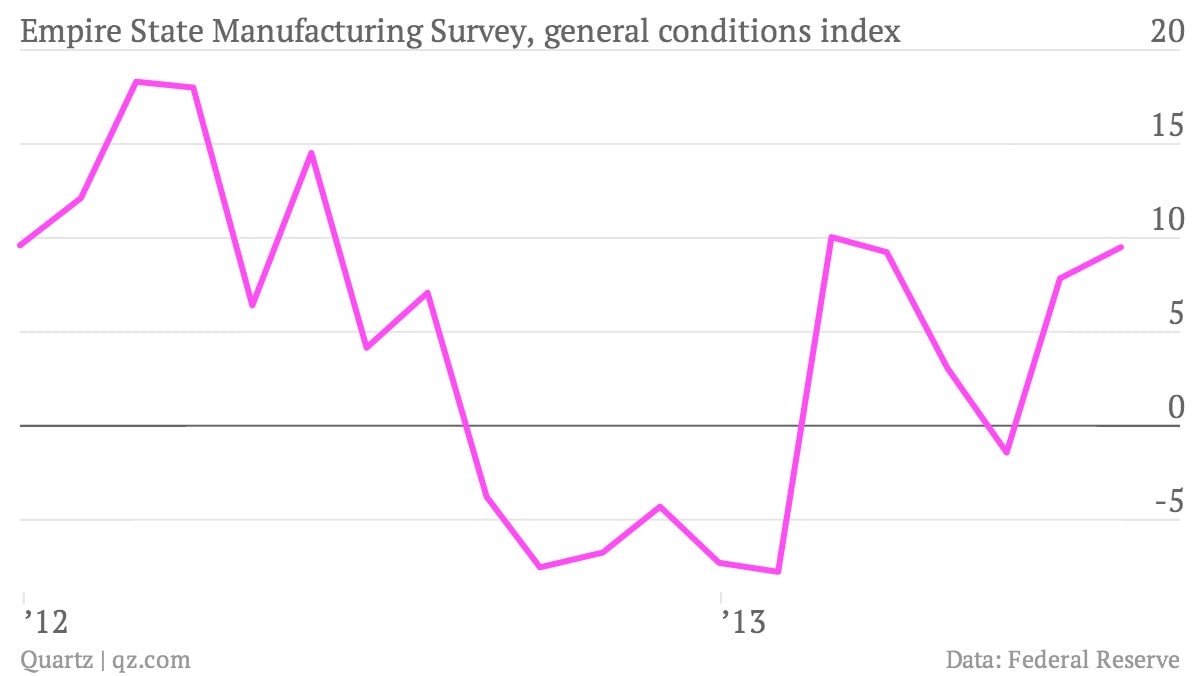
3. The Empire State Manufacturing Survey bounced further into economic expansion territory. (Which is basically anything above zero.) A gauge of manufacturing conditions in New York, the survey is one of the earliest reliable pieces of economic data available in the current month.
Tuesday
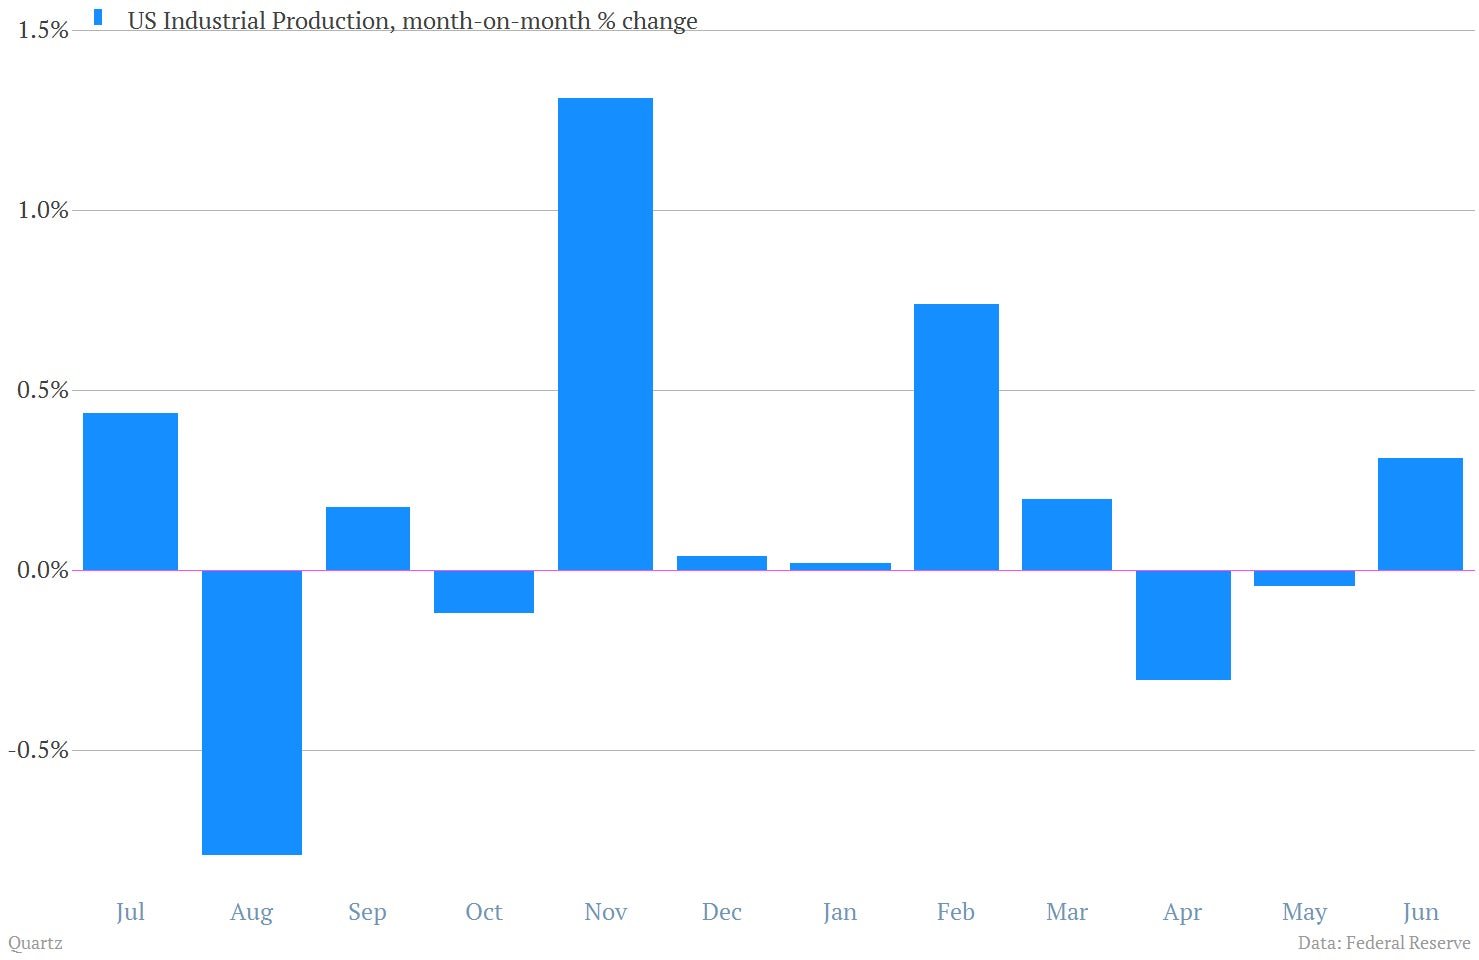
5. US industrial production did better than expected in June as factories churned out more computers and cars.
Wednesday
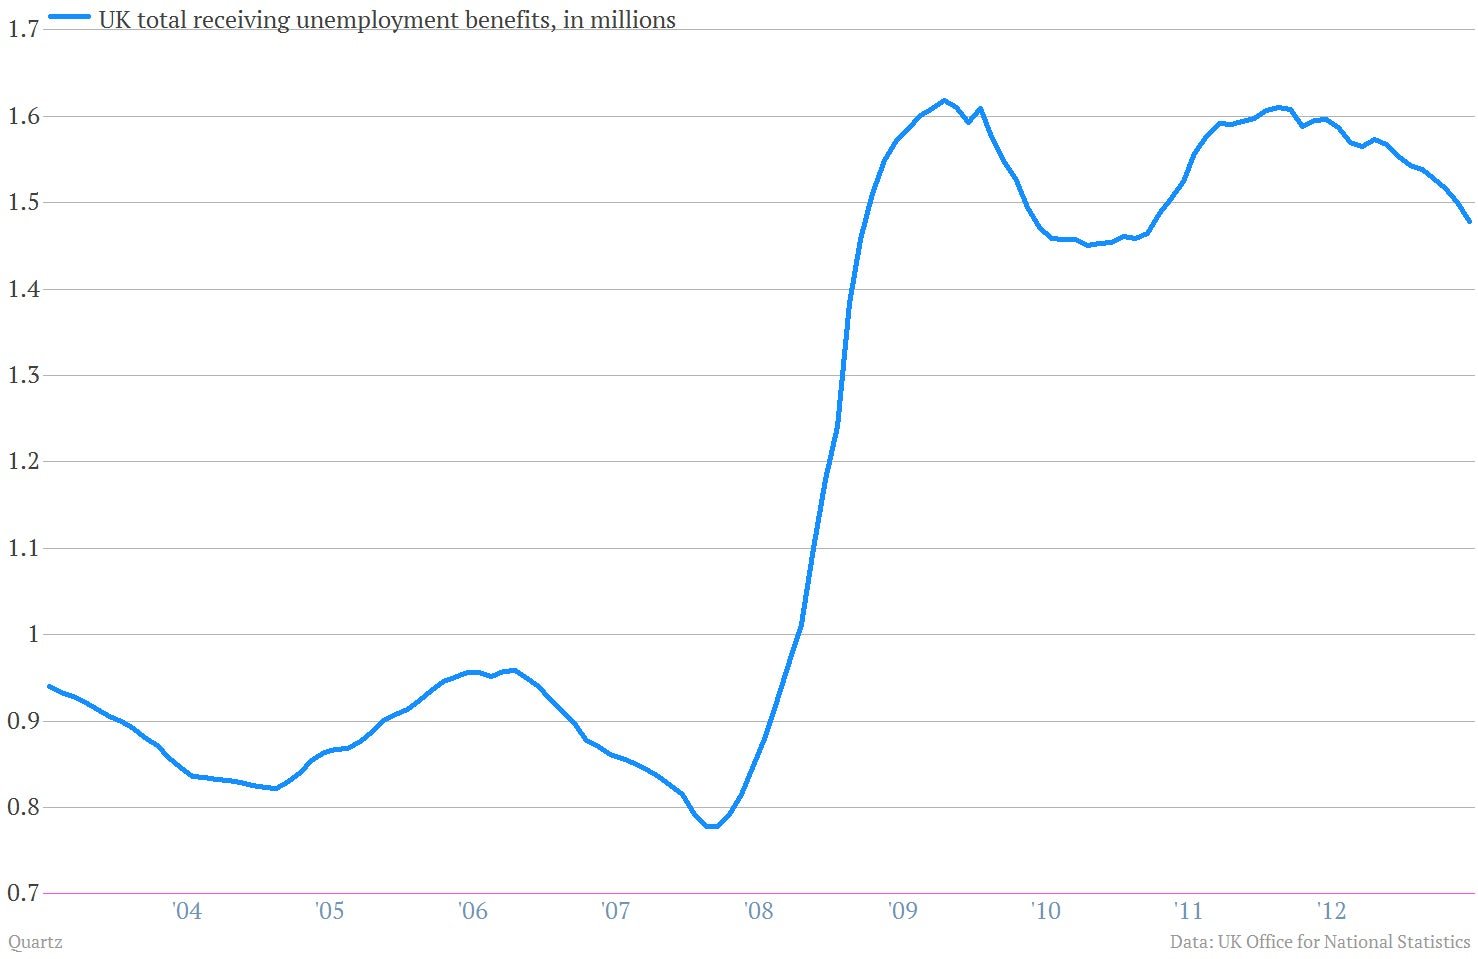
6. The UK job market showed slow improvement, as the number of people claiming unemployment benefits shrank for the eighth straight month. Still, it remains quite elevated.
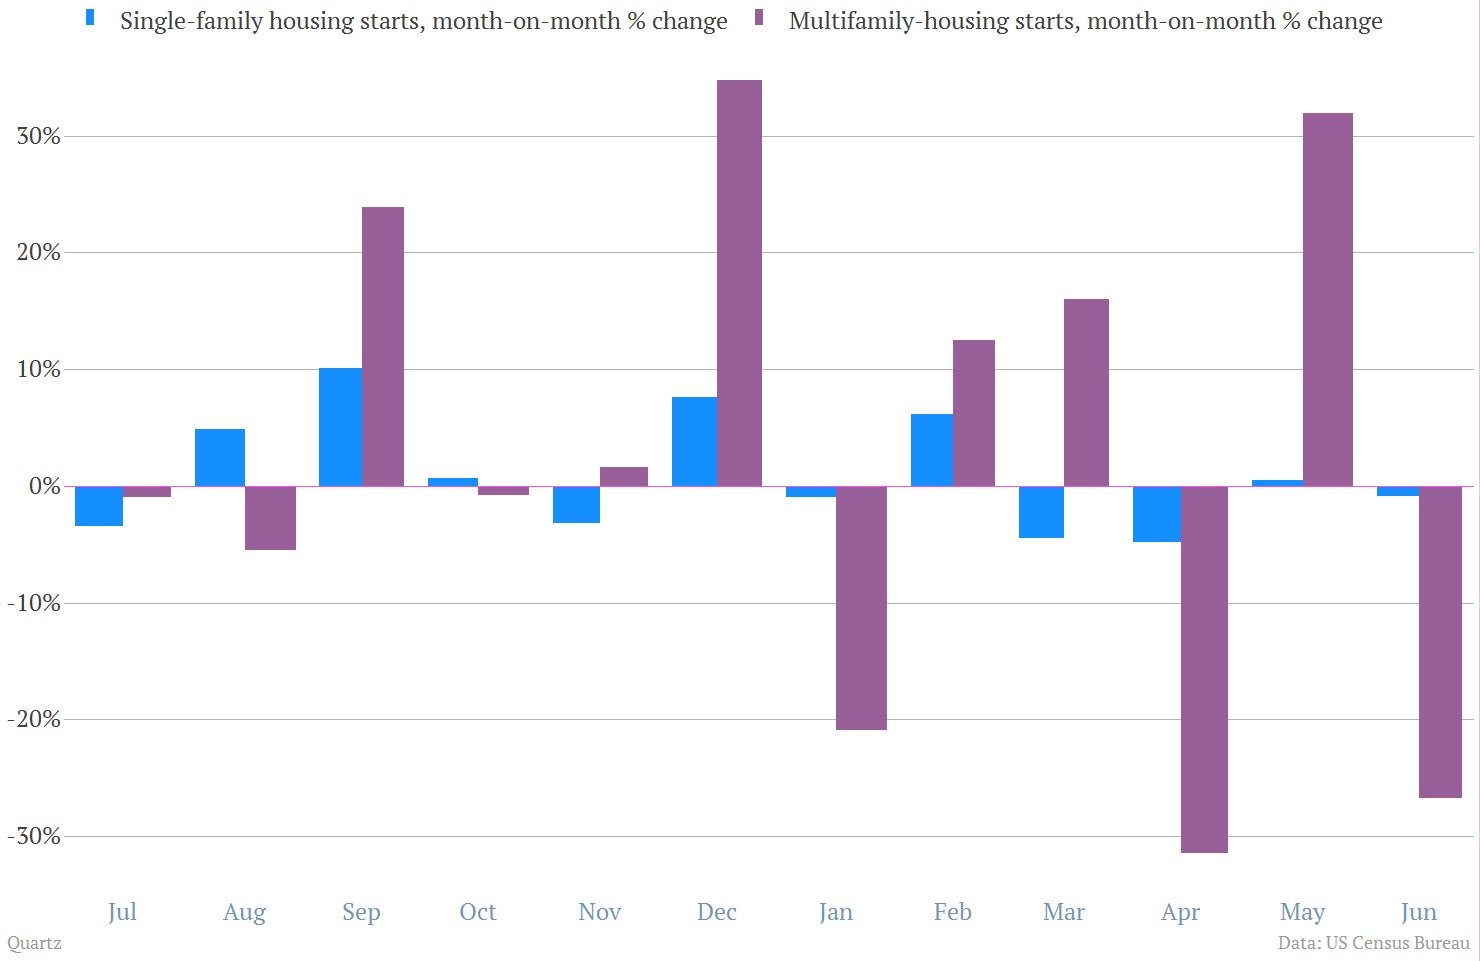
7. Headline US housing starts showed a sharp drop in June, when they fell 9.9%. But it was all driven by the volatile multifamily sector.
Thursday
8. Nominal UK retail sales rose for the second straight month, the first time they’ve pulled off the feat since last July.

Friday
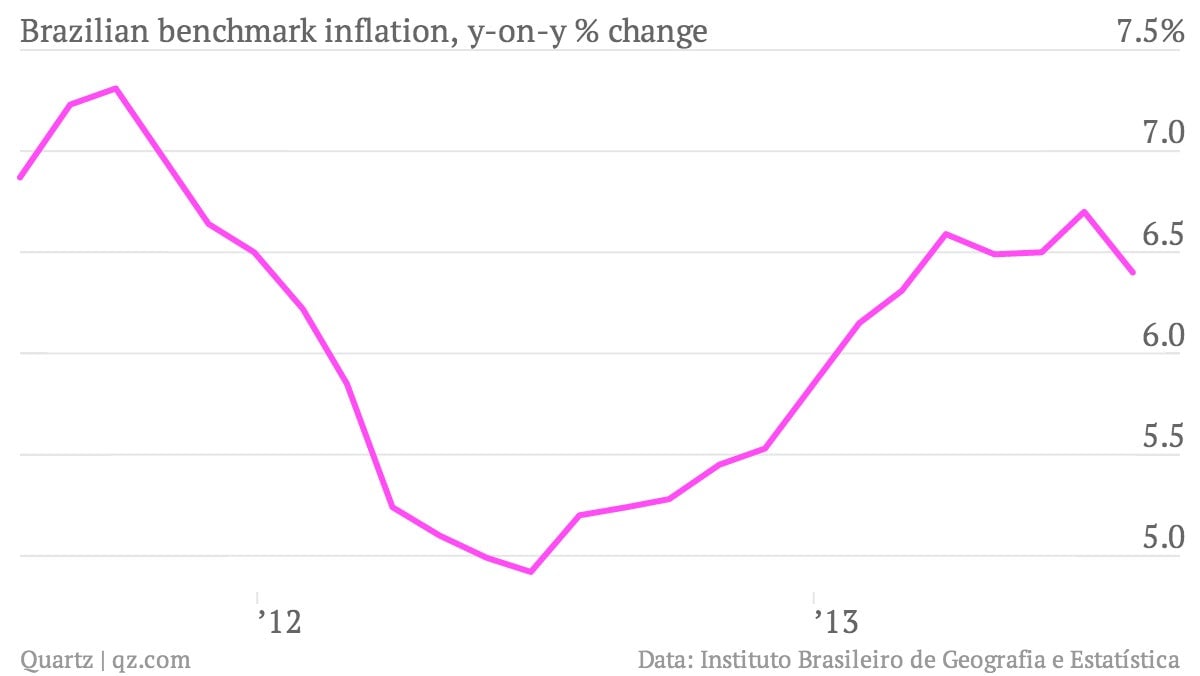
9. Brazil’s painful price increases eased slightly in early July, after officials rolled back increased prices of public transport that had helped set off mass protests.
