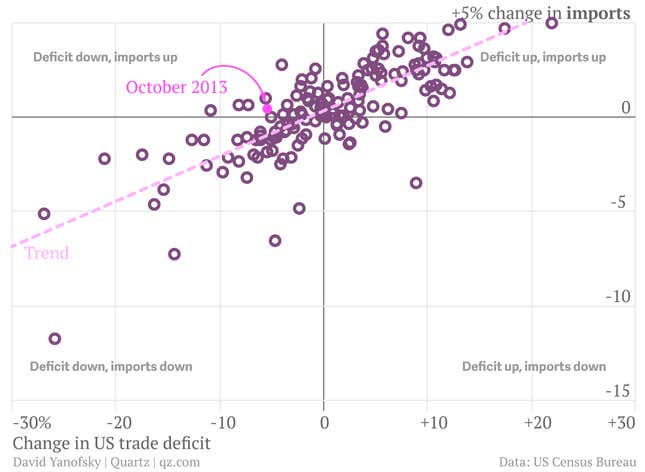
The US trade deficit is driven by Americans’ demand for imports. When US imports drop, the US trade deficit narrows. The chart below shows the relationship between the US’s monthly change in imports to the monthly change in its trade deficit for every month since 2001.

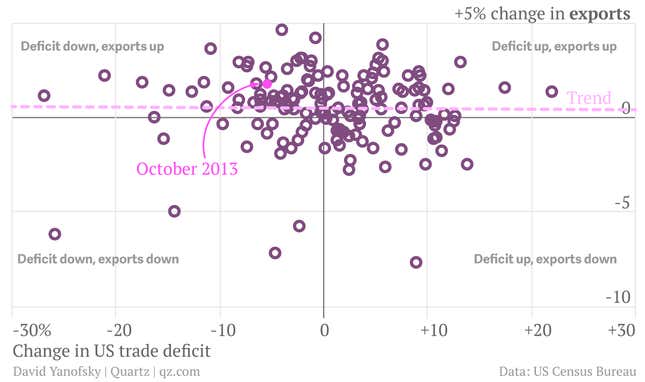
However, US exports show no similar relationship and changes in exports have been shown to have comparatively little consistent influence on the trade balance. Even though exports have the same weight as imports in the deficit calculation mathematically, the swings in US exports have shown to be far less deterministic on the overall figure. Changes in US imports typically eclipse the changes in US exports. The best-fit trend line of change in deficit to change in imports has a correlation of 0.608, the correlation of the best-fit trend line of change in deficit to exports is almost zero, 0.001.

This is what made the October trade figures so remarkable. The US trade deficit shrank significantly as a result of rising US exports, while imports remained relatively flat. Ted Wieseman, an economist at Morgan Stanley, said in a research note that the export boost was in line with other economic indicators showing increased foreign demand for US manufactured goods.
Imports grew $1.03 billion in October while exports grew $3.36 billion. The US trade deficit shrank to $40.6 billion in October with the help of sustained oil and gas exports, as well as the soybean harvest.